How can we track our mobile-e-commerce? Google analytics academy is good to start learning!

iphone-410311_640

Last week, I found that Alibaba, the biggest e-commerce in China, announced the financial result of Q2 2016.  One of things that were attracting me is 75% sales are coming from mobile device, rather than PC.

This is amazing. This is much bigger than I expected.  When we consider many younger people use mobile devices as their main devices. This rate is expected to increase steadily going forward.

Then I wonder how we can track customer behaviors on mobile-e-commerce with ease. Because it is getting more important as many customers come to your e-commerce shop from mobile devices. What do you think?


I found that Google analytics academy, which teaches how to use Google analytics, provides awesome online courses for free.  Although you may not be users of Google analytics, it is very beneficial because it shares the idea and concept of mobile-e-commerce. If you want to know which marketing generates the most valuable users, it is worth learning it. Let me explain several take aways


1. “High-value user” vs “Low-value user”

When we have many users at our mobile-e-commerce shop,  we find that some users buy many products or subscriptions than other users. They are “High-value users”. On the other hand, some users rarely buy them. They are “Low-value users”. This idea is good and useful to prepare target lists of new campaigns in order to put priority among  many customers. So our goal is to increase the number of  “High-value user” effectively.


2. Segmentation of customer is critically important

Segmentation means prepare the correct subset data to get insights form data. It is popular and widely-used across industries. When we analyze data, creating appropriate user segments are critically important. You may want create the segment of “buy-users and not-buy-users” and get the insights of what factors influence people to buy. There are many segmentations you can imagine.  You can create your own segmentations on Google analytics!


3. How to measure behavior of customers

It is also important to track behavior of each customer. There are many data to be obtained.  Ex : What screen each customer visit and what actions they take. How many minutes they stay on each screen and how much they spend to buy products. The former data is formed as “categorical” and the latter as “numerical”.  It is noted that these data should be relevant to identify and increase the number of “high-value user” as it is our goal. When you identify good candidates of data to use,  you can add them to your own segmentations and analyze them deeper in order to get insights from these data.


In addition to the on-line courses,  Google analytics makes real data of their e-commerce shop “Google Merchandise Store ” available to everyone who wants to learn it for free. It is called “Google analytics demo account“. This is also an amazing service as e-commerce data in real-world are rarely available to us before.  I would like to go deeper and get insights from them in near future.  Of course I will share it here with you as it is beneficial to everyone. Please see the one of awesome reports on Google analytics demo account.

Google analytics DA


Do you like it?  I recommend you to start learning with Google analytics academy. When you are getting familiar with data of mobile-e-commerce, it is more easier to learn more advanced data analytics, such as machine learning. Anyway, this course is free so you can access many awesome contents without paying any fee. Let us try and enjoy it!


Notice: TOSHI STATS SDN. BHD. and I do not accept any responsibility or liability for loss or damage occasioned to any person or property through using materials, instructions, methods, algorithm or ideas contained herein, or acting or refraining from acting as a result of such use. TOSHI STATS SDN. BHD. and I expressly disclaim all implied warranties, including merchantability or fitness for any particular purpose. There will be no duty on TOSHI STATS SDN. BHD. and me to correct any errors or defects in the codes and the software.


What is the marketing strategy at the age of “everything digital”?

presentation-1311169_640

In July,  I have researched TensorFlow, which is a deep learning library by Google, and performed several classification tasks.  Although it is open-source software and free for everyone, its performance is incredible as I said in my last article.

When I perform image classification task with TensorFlow,  I found that computers can see our world better and better as deep learning algorithms are improved dramatically. Especially it is getting better to extract “features“, what we need to classify images.

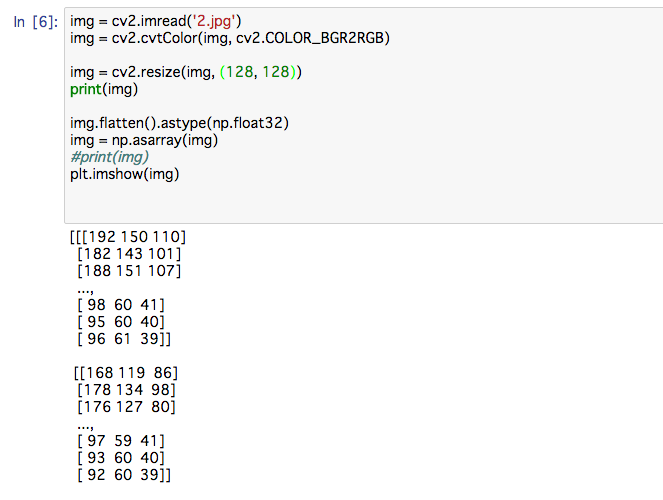
Images are just a sequence of numbers for computers. So some features are difficult for us to understand what they are. However computers can do that. It means that computers might see what we cannot see in images. This is amazing!

Open CV


Open CV2

This is an example “how images are represented as a sequence of numbers. You can see many numbers above (These are just a small part of all numbers). These numbers can be converted to the image above which we can see. But computers cannot see the image directly.  It can only see the image through numbers above. On the other hand, we can  not understand the sequence of numbers above at all as they are too complicated. It is interesting.

In marketing,  when images of products are provided,  computers might see what are needed to improve the products and to be sold more. Because computers can understand these products more in a deferent way as we do. It might give us new way to consider marketing strategy.  Let us take T shirts as an example. We usually consider things like  color, shape,  texture,  drawings on it,  price. Yes, they are examples of “features” of T shirts because T-shirts can be represented by them. But computers might think more from the images of T shirts than we do. Computers might create their own features of T-shirts.


Then, I would like to point out three things to consider new marketing strategy.

1.Computers might extract more information that we do from same images.

As I explained, computers can see the images in a different way as we do. We can say same things for other data, such as text or voice mail as they are also just a sequence of numbers for computers. Therefore computers might understand our customers behavior more based on customer related data than we do when deep learning algorithms are much improved. We sometimes might not understand how computers can understand many data because computers can understand text/speech as a sequence of numbers and provide many features that are difficult to explain for us.


2.Computers might see many kind of data as massive amount data generated by costomers

Not only images but also other data, such as text or voice mail are available for computers as they are also just a sequence of numbers for computers. Now everything from images to voice massages is going to digital.  I would like to make computers understand all of them with deep learning. We cannot say what features are used when computers see images or text in advance. But I believe some useful and beneficial things must be found.


3. Computers can work in real-time basis

As you know, computers can work 24 hours a day, 365 days a year. Therefore it can operate in real-time basis. When new data is input, answer can be obtained in real-time basis. This answer can be triggered next actions by customers. These actions also can be recorded as digital and fed to into computers again. Therefore many digital data will be generated when computers are operated without stop /rest time and the interactions with customers might trigger chain-reactions. I would like to call it “digital on digital”


Images, social media, e-mails from customers, voice mail,  sentences in promotions, sensor data from customers are also “digital”. So there are many things that computers can see. Computers may find many features to understand customer behaviors and preferences in real-time basis. We need to have system infrastructures to enable computers to see them and tell the insight from them. Do you agree with that?


Notice: TOSHI STATS SDN. BHD. and I do not accept any responsibility or liability for loss or damage occasioned to any person or property through using materials, instructions, methods, algorithm or ideas contained herein, or acting or refraining from acting as a result of such use. TOSHI STATS SDN. BHD. and I expressly disclaim all implied warranties, including merchantability or fitness for any particular purpose. There will be no duty on TOSHI STATS SDN. BHD. and me to correct any errors or defects in the codes and the software.
 

“DEEP LEARNING PROJECT for Digital marketing” starts today. I present probability of visiting the store here

cake-623579_640

At the beginning of this year,  I set up a new project of my company.  The project is called “Deep Learning project” because “Deep Learning” is used as a core calculation engine in the project. Now that I have set up the predictive system to predict customer response to a direct mailing campaign, I would like to start a sub-project called  “DEEP LEARNING PROJECT for Digital marketing”.  I think the results from the project can be applied across industries, such as healthcare, financial, retails, travels and hotels, food and beverage, entertainments and so on. First, I would like to explain how to obtain probability for each customer to visit the store in our project.


1. What is the progress of the project so far?

There are several progresses in the project.

  • Developing the model to obtain the probability of visiting the store
  • Developing the scoring process to assign the probability to each customer
  • Implement the predictive system by using Excel as an interface

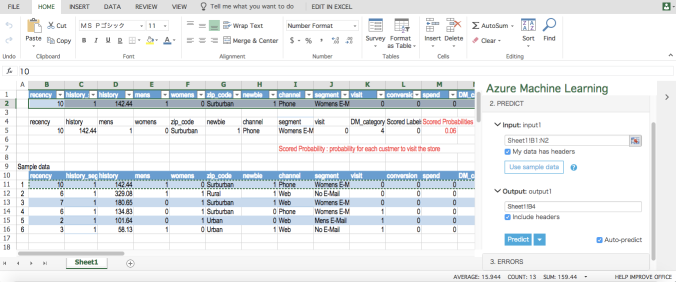
Let me explain our predictive system. We constructed the predictive system on the platform of  Microsoft Azure Machine Learning Studio. The beauty of the platform is Excel, which is used by everyone, can be used as an interface to input and output data. This is our interface of the predictive system with on-line Excel. Logistic regression in MS Azure Machine Learning is used as our predictive model.

The second row (highlighted) is the window to input customer data.

Azure ML 1

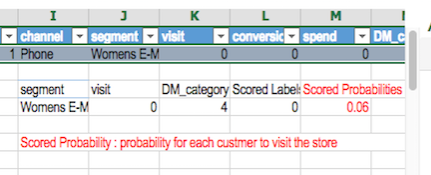
Once customer data are input, the probability for the customer to visit the store can be output. (See the red characters and number below). In this case (Sample data No.1) the customer is less likely to visit the store as Scored  Probabilities is very low (0.06)

Azure ML 3


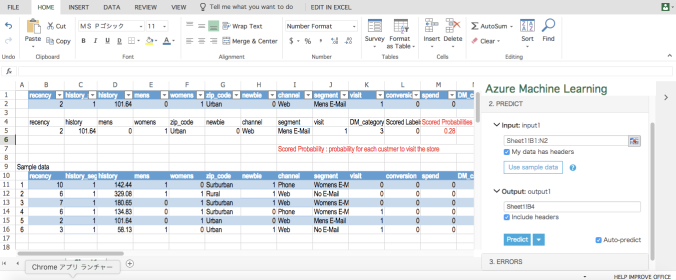
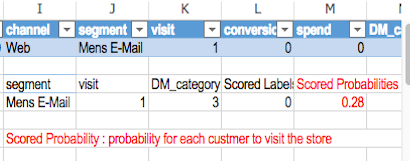
On the other hand,  In the case (Sample data No.5) the customer is likely to visit the store as Scored Probabilities is relatively high (0.28). If you want to know how it works, could you see the video?

Azure ML 2

Azure ML 4


2. What is the next in our project?

Once we create the model and implement the predictive system, we are going to the next stage to reach more advanced topics

  • More marketing cases with variety of data
  • More accuracy by using many models including Deep Learning
  • How to implement data-driven management


Our predictive system should be more flexible and accurate. In order to achieve that, we will perform many experiments going forward.


3. What data is used in the project?

There are several data to be used for digital marketing. I would like to use this data for our project.

When we are satisfied with the results of our predictions by this data,  next data can be used for our project.


Digital marketing is getting more important to many industries from retail to financial.   I will update the article about our project on a monthly basis. Why don’t you join us and enjoy it!  When you have your comments or opinions, please do not hesitate to send us!

If you want to receive update of the project or want to know the predictive system more, could you sing up here?


Microsoft, Excel and AZURE are either registered trademarks or trademarks of Microsoft Corporation in the United States and/or other countries.

Notice: TOSHI STATS SDN. BHD. and I do not accept any responsibility or liability for loss or damage occasioned to any person or property through using materials, instructions, methods, algorithm or ideas contained herein, or acting or refraining from acting as a result of such use. TOSHI STATS SDN. BHD. and I expressly disclaim all implied warranties, including merchantability or fitness for any particular purpose. There will be no duty on TOSHI STATS SDN. BHD. and me to correct any errors or defects in the codes and the software.
“DEEP LEARNING PROJECT” starts now. I believe it works in digital marketing and economic analysis

desert-956825_640

As the new year starts,  I would like to set up a new project of my company.  This is beneficial not only for my company, but also readers of the article because this project will provide good examples of predictive analytics and implementation of new tools as well as platforms. The new project is called “Deep Learning project” because “Deep Learning” is used as a core calculation engine in the project.  Through the project,  I would like to create “predictive analytics environment”. Let me explain the details.


1.What is the goal of the project?

There are three goals of the project.

  • Obtain knowledge and expertise of predictive analytics
  • Obtain solutions for data-driven management
  • Obtain basic knowledge of Deep Learning

As big data are available more and more, we need to know how to consume big data to get insight from them so that we can make better business decisions.  Predictive analytics is a key for data-driven management as it can make predictions “What comes next?” based on data. I hope you can obtain expertise of predictive analytics by reading my articles about the project. I believe it is good and important for us  as we are in the digital economy now and in future.


2.Why is “Deep Learning” used in the project?

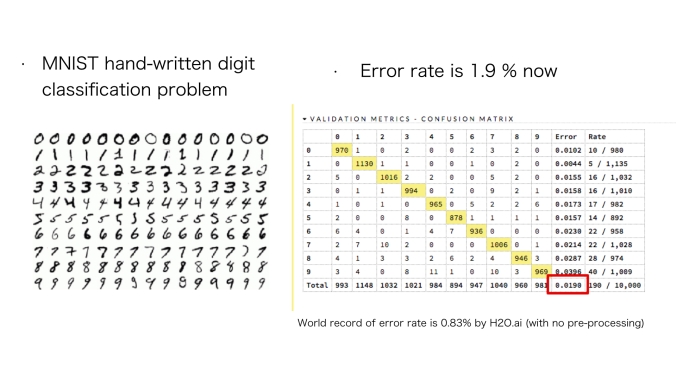
Since the November last year, I tried “Deep Learning” many times to perform predictive analytics. I found that it is very accurate.  It is sometimes said that It requires too much time to solve problems. But in my case, I can solve many problems within 3 hours. I consider “Deep Learning” can solve the problems within a reasonable time. In the project I would like to develop the skills of tuning parameters in an effective manner as “Deep Learning” requires several parameters setting such as the number of hidden layers. I would like to focus on how number of layers, number of neurons,  activate functions, regularization, drop-out  can be set according to datasets. I think they are key to develop predictive models with good accuracy.  I have challenged MNIST hand-written digit classifications and our error rate has been improved to 1.9%. This is done by H2O, an awesome analytic tool, and MAC Air11 which is just a normal laptop PC.   I would like to set my cluster on AWS  in order to improve our error rate more. “Spark” is one of the candidates to set up a cluster. It is an open source.

DL.002

3. What businesses can benefit from introducing “Deep Learning “?

“Deep Learning ” is very flexible. Therefore, it can be applied to many problems cross industries.  Healthcare, financial, retails, travels, food and beverage might be benefit from introducing “Deep Learning “.  Governments could benefit, too. In the project, I would like to focus these areas as follows.

  • Digital marketing
  • Economic analysis

I would like to create a database to store the data to be analyzed, first. Once it is created,  I perform predictive analytics on “Digital marketing” and “Economic analysis”.  Best practices will be shared with you to reach our goal “Obtain knowledge and expertise of predictive analytics” here.  Deep Learning is relatively new to apply both of the problems.  So I expect new insight will be obtained. For digital marketing,  I would like to focus on social media and measurement of effectiveness of digital marketing strategies.  “Natural language processing” has been developed recently at astonishing speed.  So I believe there could be a good way to analyze text data.  If you have any suggestions on predictive analytics in digital marketing,  could you let me know?  It is always welcome!


I use open source software to create an environment of predictive analytics. Therefore, it is very easy for you to create a similar environment on your system/cloud. I believe open source is a key to develop superior predictive models as everyone can participate in the project.  You do not need to pay any fee to introduce tools which are used in the project as they are open source. Ownership of the problems should be ours, rather than software vendors.  Why don’t you join us and enjoy it! If you want to receive update the project, could you sing up here?


Notice: TOSHI STATS SDN. BHD. and I do not accept any responsibility or liability for loss or damage occasioned to any person or property through using materials, instructions, methods, algorithm or ideas contained herein, or acting or refraining from acting as a result of such use. TOSHI STATS SDN. BHD. and I expressly disclaim all implied warranties, including merchantability or fitness for any particular purpose. There will be no duty on TOSHI STATS SDN. BHD. and me to correct any errors or defects in the codes and the software.

It is an awesome course to start learning digital marketing in 2016!

bake-1058862_640Happy new year!  This is the first article in 2016. So I would like to recommend a course to everyone who wants to learn digital marketing.

Social Media in Public Relations“is provided by Dr.Tracy Loh, Visiting Fellow Department of Communications and New Media in National University of Singapore through Coursera, one of the biggest mooc platforms.

This is good as a starting point to learn digital marketing in a theoretical manner.  I would like to introduce several interesting points from the course as they are useful and beneficial for business personnel who are interested in marketing and public relations.   These points come from week 3 ” Content Creation and Management” in the course.


1. Levels of content

There are many contents in social media so I would like to classify them effectively.   Dr.Tracy Loh provides us levels of content based on its value as follows.

Filler : information that is copied from other sources

Basic content  : original content, but relatively simple

Authority building content : Original contents that position the organization as an authority in a particular area of relevance to the organization

Pillar content : Educational content that readers use over time, save and share with others.

Flagship  : Seminal works that set the tone on an issue and which people refer back to time to come

I think this classification is very useful when we consider a portfolio of our contents  in terms of strategies of marketing and public relations. We can analyze our own content-portfolio based on levels of content. My article may be classified as “Authority building content”.  I would like to write the contents of “Flagship” in future, even though it is very difficult. Yes, you can challenge “Flagship”, too.  It should be noted that these contents should be used to reach our goals of marketing and public relation as a whole.


2. Social currency

To create viral contents, it is important that the contents have “social currency.”   Dr. Tracy Loh explains that “social currency” can be found in content that contain a level of “inner remarkability”.  For example,  when you share the new information that is not shared in your circle yet,  your social currency is increasing.  It is one of three aspects of  “social currency”. Others are explained in the course.


3. Trigger

“Trigger” is important to make content viral as daily life events can be associated with certain products.  These two examples are famous because everyone knows they are associated with daily life-events. Let us see these short videos.

Have a break, have a Kit Kat

What time is it?   It’s Tiger Time

Dr.Tracy Loh introduces this phrase  “Social currency gets people talking, but triggers keep them talking. Top of mind means tip of tongue.” (Jonah Berger, 2013)


I think we can apply these points above to our marketing strategies effectively.  Because they are theory-driven, but not so complicated.  It is easy to get some insights based on the points I referred.

I mentioned just a part of the course for the purpose of introduction. This course has many interesting topics and provides us knowledge of social media. It is free to just see the course. When you need the certification of the course,  some cost is needed to pay. I would like to recommend for you to overview the course first, and if you like it,  you can upgrade the course with the certification when it is available.  Let us enjoy this course in 2016!

“H2O”, this is an awesome tool of “Digital marketing” for everyone!

fruit-1004887_640

Last week I found the awesome tool for digital marketing as well as data analysis.  It is called “H2O“.  Although it is open source software, its performance is incredible and easy to use.  I would like to introduce it to Sales/Marketing personnel who are interested in Digital marketing.

“H2O is open-source software for big-data analysis. It is produced by the start-up H2O.ai(formerly 0xdata), which launched in 2011 in Silicon Valley. The speed and flexibility of H2O allow users to fit hundreds or thousands of potential models as part of discovering patterns in data. With H2O, users can throw models at data to find usable information, allowing H2O to discover patterns. Using H2O, Cisco estimates each month 20 thousand models of its customers’ propensities to buy while Google fits different models for each client according to the time of day.” according to Wikipedia(1).

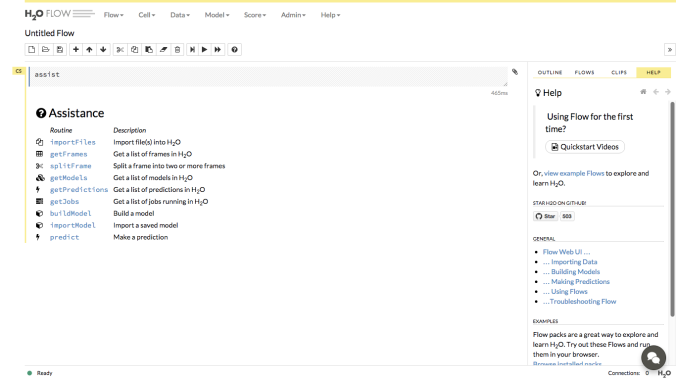
Although its performance looks very good, it is open source software. It means that everyone can use the awesome tool without any fee.  It is incredible!  “H2O” is awarded one of ” Bossie Awards 2015: The best open source big data tools” (2).  This image shows H2O user interface “H2O FLOW”.

H2O Flow

By using this interface, you can use the state of art algorithm such as “Deep learning” without programming.  It is very important for beginners of data analysis. Because they can start data analysis without programming anyway.  Dr. Arno Candel,   Physicist & Hacker at H2O.ai. , said  “And the best thing is that the user doesn’t need to know anything about Neural Networks”(3).  Once models are developed by this user interface, program of the model with “Java” is automatically generated.  It can be used in production systems with ease.


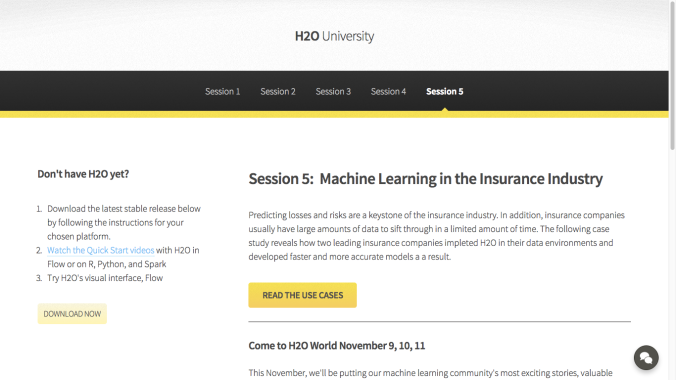
One of the advantages of open source is that many user’s cases are publicly available. Open source can be public, therefore it is easy to be distributed as users’ experiences of “What is good?” and “What is bad?”.   This image is a collection of tutorials “H2O University“.  It is also available for free. There are many other presentations, videos about H2O in the internet, too! You may find your industry”s cases among them. Therefore, there is a lot of materials to learn H2O by ourselves.

H2O Univ


In addition to that,  “H2O” can be used as an extension of “R“.  R is one of the most widely-used analytical language.  “H2O” can be controlled from R console easily. Therefore  “H2O” can be integrated with R.  “H2O” also can be used with Python.

There are so many other functionalities in H2O. I cannot write everything here.  I am sure it is an awesome tool for both business personnel and data scientists.  I  would like to start using “H2O” and publish my experiences of “H2O”going forward. Why don’t you join “H2O community”?


Source

1.Wikipedia:H2O (software)

https://en.wikipedia.org/wiki/H2O_(software)

2.Bossie Awards 2015: The best open source big data tools

http://www.infoworld.com/article/2982429/open-source-tools/bossie-awards-2015-the-best-open-source-big-data-tools.html#slide4

3.Interview: Arno Candel, H2O.ai on the Basics of Deep Learning to Get You Started

http://www.kdnuggets.com/2015/01/interview-arno-candel-0xdata-deep-learning.html


Note: Toshifumi Kuga’s opinions and analyses are personal views and are intended to be for informational purposes and general interest only and should not be construed as individual investment advice or solicitation to buy, sell or hold any security or to adopt any investment strategy.  The information in this article is rendered as at publication date and may change without notice and it is not intended as a complete analysis of every material fact regarding any country, region market or investment.

Data from third-party sources may have been used in the preparation of this material and I, Author of the article has not independently verified, validated such data. I and TOSHI STATS.SDN.BHD. accept no liability whatsoever for any loss arising from the use of this information and relies upon the comments, opinions and analyses in the material is at the sole discretion of the user. 

Salesforce and Microsoft. Is the team a game changer of digital marketing?

bananas-282340_640

Since Salesforce announced partnership with Microsoft® in May 2014 (1),  there might be a lot of rumors about this team.  Dreamforce in 2015 was held in San Francisco in the U.S on 15-18 September.  I found that this partnership is progressing rapidly.  As you  know, Salesforce is a king of CRM and Microsoft dominates the enterprise software market. Most of us use MS office365™ in our daily life.  Let us consider why this team might be a game changer in digital marketing.


1. One to one engagement

Salesforse said “How can you create One to one engagement with your customers? (2) There must be many answers. In my view we need to know what customers want more deeply in a real-time basis, then we should react it. To do that, we should have a mechanism to process massive amount data from customers effectively. I want to call it “Front, Back and Middle” mechanism. Front should face customers directly and collect data such as e-mails, phone calls, click-logs on mobile devices, purchases of products, payments, claims, and so on.  Back should record and store the data collected from front into storages or database.  Middle should analyze the data and provide insights to front so that front can make better business decisions. These processes are recurrent an they should be done many times in a seamless manner.  Sales personnel can obtain information and insights from this mechanism in real time-basis and face each customer one to one basis. In my view, that is “one to one engagement”.


2. The combination of strong Front and Strong MIddle/Back

Salesforce(SF) is a king of CRM. It means that SF is the strong front.  Microsoft (MS) expands its PaaS,  MS AZURE™ aggressively.  MS AZURE™ has a function of machine learning called AZURE ML . In MS AZURE™, there are many choices of database. Therefore, MS has strong middle and back.  Users can enjoy this strong combination of “front, middle and back” as the partnership between SF and MS is deepened recently.  I hope I can choose many functions from SF/ MS and set up systems based on my own preferences  in the future.   In my view,  this combination might be better than combinations between other big IT companies as corporate culture of SF/MS seems to be similar each other.  Since Satya Nadella became CEO of MS in Feb 2014,  MS culture seems to be changed from a traditional software company to a startup-minded cloud company.


3. More choices for users

PaaS can be used independently. Technologies are developing so fast, however, it seems to be difficult, that only one company covers everything to satisfy users’ needs. Therefore, partnerships like SF/MS may appear in IT industry in the future. It is good because users can have more choices  to reach their goal.  You can combine tools/ modules and try to pursue your own “one to one engagement”.


Since Facebook appeared in 2004,  SNS and message tools are getting popular and popular, especially in younger generations all over the world.  In principle, communications in SNS and message tools are one to one basis.  Therefore, it is natural that marketing activities by companies are also shifting from mass communication-type marketing to one to one engagement.  Mobile phones will be available at lower cost in emerging markets in the future and more people will be connected to the internet. It means that one to one engagement will be more important than it is now for companies that want to reach customers.

Although there are overlaps between two big IT software companies,  it seems that their partnership is strengthened going forward. I would like to keep watching what is going on between the two companies.  It must be exciting, isn’t it?


Source

1. Salesforce and Microsoft

https://www.salesforce.com/campaigns/microsoft/

2. Twitter of Salesforce


Salesforce, Dreamforce and others are trademarks of salesforce.com, inc. and are used here with permission.

Microsoft, Encarta, MSN, and Windows are either registered trademarks or trademarks of Microsoft Corporation in the United States and/or other countries.


Note: Toshifumi Kuga’s opinions and analyses are personal views and are intended to be for informational purposes and general interest only and should not be construed as individual investment advice or solicitation to buy, sell or hold any security or to adopt any investment strategy.  The information in this article is rendered as at publication date and may change without notice and it is not intended as a complete analysis of every material fact regarding any country, region market or investment.

Data from third-party sources may have been used in the preparation of this material and I, Author of the article has not independently verified, validated such data. I and TOSHI STATS.SDN.BHD. accept no liability whatsoever for any loss arising from the use of this information and relies upon the comments, opinions and analyses in the material is at the sole discretion of the user.