“Stable Diffusion” is going to lead innovations in computer vision in 2023. It must be exciting!

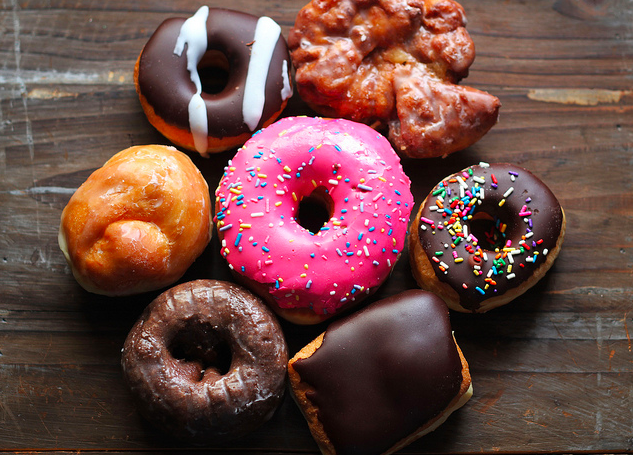
Hi friends. Happy new year! Hope you are doing well. Last year, I found a new computer vision model, called “Stable Diffusion” in September. Since then, many AI researchers, artists and illustrators are crazy about that because it can create high quality of images easily. The image above is also created by “Stable Diffusion”. This is great!

1. I created many kinds of images by “Stable Diffusion”. They are amazing!

These images below were created in the experiments by “Stable Diffusion” last year. I found that it has a great ability to generate many kinds of images from oil painting to animation. With fine-tuning by “prompt engineering”, they are getting much better. It means that we should input appropriate words / texts into the model then the model can generate images that we want more effectively.

2. “Prompt engineering” works very well

In order to generate images that we want, we need to input the appropriate “prompt” into the model. We call it “prompt engineering” as I said before,

If you are a beginner to generate images, you can start it with a short prompt such as ” an apple on the table”. When you want the image which looks oil painting, you can just add it such as “oil painting of an apple on the table”.

Let us divide each prompt into three categories

  • Style
  • physical object
  • the way the physical object is displayed (ex. lighting)

So all we have to do is to consider what “each category of our prompt” is and input it into the model. For example “oil painting of an apple on the table, volumetric light’ . The results are images below. Why don’t you try it by yourself?

3. More research needed

Some researchers in computer vision think “Prompt engineering” can be optimized by computers. They developed the model to optimize it. In the research paper(1), they compare hand made prompt vs AI optimized prompt (see the images below). Which do you like better? I am not sure optimization always works perfectly. Therefore I think more research is needed with many use cases.

I will update my article to see how the technology is going in the future. Stay tuned!

1) Optimizing Prompts for Text-to-Image Generation Yaru Hao, Zewen Chi, Li Dong, Furu Wei, Microsoft Research, 19 Dec 2022, https://arxiv.org/abs/2212.09611

Notice: ToshiStats Co., Ltd. and I do not accept any responsibility or liability for loss or damage occasioned to any person or property through using materials, instructions, methods, algorithms or ideas contained herein, or acting or refraining from acting as a result of such use. ToshiStats Co., Ltd. and I expressly disclaim all implied warranties, including merchantability or fitness for any particular purpose. There will be no duty on ToshiStats Co., Ltd. and me to correct any errors or defects in the codes and the software.

“Stable Diffusion” is a game changer of computer vision. It is amazing!

Hi friends. Hope you are doing well. Today, I would like to introduce a new computer vision model, called “Stable Diffusion”. This is an open source software. It means that you can use it for free, just download it without paying money for a license. It is good for anyone who is interested in computer vision. The image above is created by “Stable Diffusion”. It looks so good! I love that because it is very easy to create such beautiful images.

1.These images are amazing!

These images are created from the same text. When you see the background of each image, you may know where the girl stays. Yes it is “a cafe” because I make a text to order that she is in a cafe. As you know this is a “text to image generative model”. It means that we should input some words / texts into the model then the model can generate images based on this instruction. It is very interesting as I feel like I can communicate with computers when I create these images.

2. It is “open source software”

If I have to pay a lot of money to use it, it is not so impressive because very few people can do that. Fortunately, however, it is an open source software so everyone can use it for free! If you want to integrate “Stable Diffusion” into your products, no problem. If you want to create an updated version of this software, you can do that because it is open source software. So I want to make my own products with it in the near future. Why don’t you try it by yourself? If you are interested in “Stable Diffusion”, I recommend you to watch a youtube video about an interview of Emad Mostaque, founder of Stability AI (1). This company creates “Stable Diffusion” . The details of release information are provided here (2). Please check the terms of the licence of this software, too. 

3. It can change the direction of computer vision and beyond

The blog says “This release is the culmination of many hours of collective effort to create a single file that compresses the visual information of humanity into a few gigabytes.”. I cannot predict what can be achieved by this software exactly. But I can say many things , which used to be impossible, can be possible with this software. It means that “Stable Diffusion” enables all of us to create products, services and arts, which are unseen yet. This is definitely “democratization of AI”. I expect a tsunami of new kinds of products, services and arts will appear in the near future. It must be exciting!

I will update my article to see how this new software is going in the future. Stay tuned!

1] The Man behind Stable Diffusion https://www.youtube.com/watch?v=YQ2QtKcK2dA&t=942s

2) Stable Diffusion Public Release https://stability.ai/blog/stable-diffusion-public-release

Notice: ToshiStats Co., Ltd. and I do not accept any responsibility or liability for loss or damage occasioned to any person or property through using materials, instructions, methods, algorithms or ideas contained herein, or acting or refraining from acting as a result of such use. ToshiStats Co., Ltd. and I expressly disclaim all implied warranties, including merchantability or fitness for any particular purpose. There will be no duty on ToshiStats Co., Ltd. and me to correct any errors or defects in the codes and the software.

“GRAPH ATTENTION NETWORKS”, it is awesome as it has attention mechanisms

Today, I would like to introduce “GRAPH ATTENTION NETWORKS” (GAT) (1). I like it very much as it has attention mechanisms. Let us see how it works.

  1. which nodes should we pay more attention to?

As I said before, GNN can be updated by taking information from neighbors. But you may be wondering which information is more important than others. In other words, which nodes should we pay more attention to? As the chart shows, the information from some nodes is more important than others. In the chart, rhe thicker red arrows from sender nodes to the receiver node is, the more attention GAT should pay to the node. But how can we know to which nodes should be paid more attention?  

2. Attention mechanism

Some of you may not know about “attention mechanisms”, so I will explain it in detail. It is getting popular when the Natural Language processing (NLP) model called “transformer” introduces this mechanism in 2017. In this NLP model can understand what words are more important than others when the model considers one specific word in sentences. GAT introduces the same mechanism to understand “which nodes GAT should pay more attention to than other nodes when the information is gathered from neighbors?”. The chart below explains how the attention mechanism works. They are taken from the original research paper of GAT (1).

In order to understand “what nodes GAT should pay more attention to”, attention weights (red arrow) are needed. The bigger these weights are, the more attention GAT should pay. To calculate attention weights, firstly features of sender node(green arrow) and receiver node(blue arrow) are linearly transformed and concatenated. eij is calculated by a single layer neural network (formula 1). This is called “self-attention” and eij is called “attention coefficient”. Once attention coefficients of all sender nodes are obtained, we put them into the softmax function to normalize them (formular 2). Then “attention weights” of aij can be obtained (right illustration). When you want to know more, please check formula 3. Finally the receiver node can be updated base on “attention weights” aij (formula 4).

3. multi-head attention

GAT introduces multi-head attention. It means that GAT has several attention mechanisms (right illustration). K attention mechanisms execute the transformation of formula 4, and then their features are concatenated (formula 5). When we perform multi-head attention on the final layer of the network, instead of concatenation, GAT uses average of results from each attention head and delays applying a softmax for classification task (formula 6).

Hope you enjoy the article. I like GAT as it is easy to use and more accurate than other GNNs I explained before. I will update my article soon. Stay tuned!

(1) GRAPH ATTENTION NETWORKS, Petar Veličković, Guillem Cucurull, Arantxa Casanova, Adriana Romero, Pietro Liò, Yoshua Bengio

Notice: ToshiStats Co., Ltd. and I do not accept any responsibility or liability for loss or damage occasioned to any person or property through using materials, instructions, methods, algorithms or ideas contained herein, or acting or refraining from acting as a result of such use. ToshiStats Co., Ltd. and I expressly disclaim all implied warranties, including merchantability or fitness for any particular purpose. There will be no duty on ToshiStats Co., Ltd. and me to correct any errors or defects in the codes and the software.

Node Classification with Graph Neural Networks by PyG !

Last time, I introduced GCN (“GRAPH CONVOLUTIONAL NETWORKS”) in theory. Today, I would like to solve the problem with GCN. Before doing that, I choose the best framework for graph neural networks. This is “PyG”(1).

  1. PyG (PyTorch Geometric)

Let me look at the explanations of PyG in its official document.

“PyG is a library built upon PyTorch to easily write and train Graph Neural Networks for a wide range of applications related to structured data. PyG is both friendly to machine learning researchers and first-time users of machine learning toolkits.”

I thinks it is the best for beginners because

  • It is based on Pytorch, which is written in python and widely used in deep learning tasks.
  • There are well-written documents and notebook tutorials.
  • It has many “out of the box” functions so we can start experiments with GNN immediately.

2. Prepare graph data

Our task is called “node classification”. It means that each node has its class (Ex: age, rating, income, fail or success, default or not default, purchase or no-purchase, cured or not cured, whatever you like). We would like to predict “what the class of each node is” based on the graph data. 

Let me introduce “Cora" dataset(2), citation network. Each node represents a document. It has a 1433-dimensional feature and belongs to one of the seven classes. Each edge means a citation from the document to another. Our task is to predict the class of each document. Let us visualize each node before training our GCN as a dot below. We can see seven colours as there are seven colours in this graph.

3. GCN implementaion with PyG

Let us train GCN to analyse the graph data now. I explained how GCN works before so when you missed it, check it up.

This is a GCN implementaion with PyG. PyG has GCN in it. So all we have to do is 1. import GCNConv, 2. create a class by using GCNComv. That’s it! It looks easy if you are already familiar with Pytorch. When you want to run the whole notebook, it is available for you in the PyG official document. Here the link is.

Here is the result of our analysis. It looks good as nodes are classified into seven classes.

GCN can be applied to many tasks as it has a simple structure. Why don’t you try it by yourself with PyG today?

(1) PyG (PyTorch Geometric)  https://www.pyg.org/

(2) Revisiting Semi-Supervised Learning with Graph Embeddings Zhilin Yang, William W. Cohen, Ruslan Salakhutdinov, May 2016

Notice: ToshiStats Co., Ltd. and I do not accept any responsibility or liability for loss or damage occasioned to any person or property through using materials, instructions, methods, algorithms or ideas contained herein, or acting or refraining from acting as a result of such use. ToshiStats Co., Ltd. and I expressly disclaim all implied warranties, including merchantability or fitness for any particular purpose. There will be no duty on ToshiStats Co., Ltd. and me to correct any errors or defects in the codes and the software.

“GRAPH CONVOLUTIONAL NETWORKS”. It is one of the most popular GNN

Last time I explained how GNN works. It gathers information from neighbors and aggregates them to predict classes we are interested in. Today, I would like to go deeper with one of the most popular GNN called “GRAPH CONVOLUTIONAL NETWORKS” or “GCN”(1). Let us start step by step.

1. Adjacency Matrix

As you know, a graph has edges or links among nodes. Therefore, a graph can be specified with an adjacency matrix A and node features H. A adjacency matrix is very useful to present the relationship among nodes. If a graph has a link from node “i” to node “j”, the element of A, whose row is “i” and column is “j” is “1”, otherwise “0”. It is shown in the chart below. If a node has a link to itself, diagonal elements are “1” in adjacency matrix.

2. Gather information from neighbors

Let us explain the chart below. 1. The node, which is red in the chart, gathers information from each neighbor. 2. The information is aggregated to update the node. The way for aggregation can be sum or average. 

As I said above, a graph can be specified with an adjacency matrix A and node features H or X. I introduce W as a matrix to show learnable weights and D is a matrix to show us the degree of A. It is noted that diagonal elements are “1” in adjacency matrix here. σ is a non linear function.

In GCN, the way to gather information is as follows (1).

It means that information from neighbors are weighted based on the degree of the sender (green one) and the receiver (red one) as well.  All information is aggregated to update the receiver (red one).

In the formula below, GCN is also considered more generally that the features of the neighborhood are directly aggregated with fixed weights (2).


“Cuv” is considered as the importance of node v to node u. It is a constant that directly depends on the entries in an adjacency matrix A.

That’s it! Hope you can understand how GCN works. In the next article, I would like to solve the problem with GCN. Stay tuned!

(1) SEMI-SUPERVISED CLASSIFICATION WITH GRAPH CONVOLUTIONAL NETWORKS, Thomas N. Kipf & Max Welling, 22 Feb 2017

(2) Geometric Deep Learning Grids, Groups, Graphs, Geodesics, and Gauges, p79, Michael M. Bronstein, Joan Bruna, Taco Cohen, Petar Veličković, 4 May 2021

Notice: ToshiStats Co., Ltd. and I do not accept any responsibility or liability for loss or damage occasioned to any person or property through using materials, instructions, methods, algorithms or ideas contained herein, or acting or refraining from acting as a result of such use. ToshiStats Co., Ltd. and I expressly disclaim all implied warranties, including merchantability or fitness for any particular purpose. There will be no duty on ToshiStats Co., Ltd. and me to correct any errors or defects in the codes and the software.

Graph Neural Networks are very flexible to design models for data analysis

Last time, I introduced Graph Neural Networks (GNN) as a main model to analyze complex data. Let us see how GNN works in detail.

1. What Does Graph Data Look like?

Unlike tabular data, the graph has edges between nodes. It is very interesting because many things have inter relationship with each other, such as…

  • Investors behavior are affected each other in financial markets
  • Rumors are spread and impact people’s decisions in social network
  • Consumers may like the products which are already popular in the market
  • One marketing strategy affects the results of other marketing strategies in the company
  • In the board game called “Go”, some part of results affect other parts of results on Go board

These structures are shown just like the graph below. It is based on the karate club data(1). Each node means each member in the club. The graph(2) shows us four groups in the club. There are edges between nodes and these structures are very important in analyzing data.

2. How can GNN models be trained?

Each node is expressed as vectors (example : [0 1 0 0 5]). It is called “node features” or just “features” in machine learning. When models are trained, each node takes the information from neighbors and is updated based on this information. Yes, it looks simple! One of the ways to take the info from neighbors is the “sum” of information from neighbors. Another is to take the average. We iterate these updates until the loss function can be converged.

It is noted that we can sum up or take the average in the same manner even if the structures of the graph are changed. This is why GNN is very flexible to design the models. 

3. How can the predictions from GNN models be obtained?

After training of models, we can obtain predictions based on the graph. In GNN, there are three kinds of predictions.

  • node prediction : Each node should be classified according to labels. For example, in the Karate club above, each member should be classified as the member in one of the four teams shown in the chart above.
  • graph prediction : Based on the whole structure of the graph, it should be classified. For example, a new antibiotic may be classified whether it works well or not for treatments against certain diseases.
  • link prediction : When each node means each customer or each product, the edges between customers and products can mean the purchase in the past. If we can create better node features based on graph structures, recommendations can be provided to inform which products you may like more accurately.

Hope you can understand how GNN works well. It is very flexible to design. Next, I would like to explain what kind of GNN models are popular in the industries. Stay tuned!

(1) Wayne W. Zachary. An information flow model for conflict and fission in small groups. Journal of
anthropological research, pp. 452–473, 1977.

(2) SEMI-SUPERVISED CLASSIFICATION WITH GRAPH CONVOLUTIONAL NETWORKS, 22 Feb 2017, Thomas N. Kipf & Max Welling

Notice: ToshiStats Co., Ltd. and I do not accept any responsibility or liability for loss or damage occasioned to any person or property through using materials, instructions, methods, algorithms or ideas contained herein, or acting or refraining from acting as a result of such use. ToshiStats Co., Ltd. and I expressly disclaim all implied warranties, including merchantability or fitness for any particular purpose. There will be no duty on ToshiStats Co., Ltd. and me to correct any errors or defects in the codes and the software.

Graph Neural Networks can be a game changer in Machine Learning!

Happy new year! As new year comes, I’m thinking about what to do about AI this year. After exploring various things, I decide to concentrate on “Graph Neural Networks” in 2022. I’ve heard the name “Graph Neural Networks” before, but since the success stories have been reported in several applications last year, I think it is the right time to work on it in 2022.

Graph is often represented by a diagram connecting dots, just like this.

Dots are called “nodes” and there are “edges” between nodes. They are very important in “Graph Neural Networks” or “GNN” in short.

These can be expressed intuitively with Graph. So they can be analysed by GNN.

  • Social network
  • Molecular structure of the drug
  • Structure of the brain
  • Transportation system
  • Communications system

If you have a structure that emphasizes relationships between nodes or dots, you can express it in Graph and use GNN for analysis. Due to its complexity, GNN hasn’t appeared much as an AI application, but in last year, I think we’ve seen a lot of success results. It seems that the number of papers on GNN published is increasing steadily.

In August of last year, DeepMind and Google researchers released that they predicted the arrival time at the destination using Google Map data and improved the accuracy. The roads were graphed by segment and analyzed using “Graph Neural Networks”. The structure of the model itself seems to be unexpectedly simple. For details, please see 3.2 Model Architecture in the research paper (1).

There are many other successful cases. Especially in the field of drug discovery, it seems to be expected.

Theoretically, “Graph Neural Networks” is a fairly broad concept and seems to have various models. The theoretical framework is also deepening with the participation of leading researchers, and research is likely to accelerate further in 2022.

So, “Graph Neural Networks” is a very interesting to me. When I find good examples, I would like to update it here. Stay tuned!

1)ETA Prediction with Graph Neural Networks in Google Maps, 25 Aug 2021

Notice: ToshiStats Co., Ltd. and I do not accept any responsibility or liability for loss or damage occasioned to any person or property through using materials, instructions, methods, algorithms or ideas contained herein, or acting or refraining from acting as a result of such use. ToshiStats Co., Ltd. and I expressly disclaim all implied warranties, including merchantability or fitness for any particular purpose. There will be no duty on ToshiStats Co., Ltd. and me to correct any errors or defects in the codes and the software

BERT performs near state of the art in question and answering! I confirm it now

Today, I write the article of BERT, which a new natural language model, again because it works so well in question and answering task. In my last article, I explained how BERT works so if you are new about BERT, could you read it?

For this experiment, I use SQuADv1.1data as it is very famous in the field of question and answering.  Here is an explanation by them.

“Stanford Question Answering Dataset (SQuAD) is a reading comprehension dataset, consisting of questions posed by crowd workers on a set of Wikipedia articles, where the answer to every question is a segment of text, or span, from the corresponding reading passage, or the question might be unanswerable.” (This is from SQuAD2.0, a new version of Q&A data)

This is a very challenging task for computers to answer correctly. How does BERT work for this task? As you saw below, BERT recorded f1 90.70 after one-hour training on TPU on colab in our experiment. It is amazing because based on the Leaderboard of SQuAD1.1 below, it is the third or fourth among top universities and companies although the Leaderboard may be different from our experiment setting. It is also noted BERT is as good as a human is!


I tried both Base model and Large model with different batch size.  Large model is better than Base model with around 3 points. Large model takes around 60 minutes to complete training while Base model takes around 30 munites. I use TPU on Google colab for training. Here is the result. EM means “exact match”.

Question & answering can be applied to many tasks in businesses, such as information extraction from documents and automation for customer centers. It must be exciting when we can apply BERT to businesses in the near future.


Next, I would like to perform text-classification of news title in Japanese because BERT has a multi-language model which works in 104 languages globally. As I live in Tokyo now, it is easy to find good data for this experiment. I will update my article soon. So stay tuned!


@article{devlin2018bert,
  title={BERT: Pre-training of Deep Bidirectional Transformers for Language Understanding},
  author={Devlin, Jacob and Chang, Ming-Wei and Lee, Kenton and Toutanova, Kristina},
  journal={arXiv preprint arXiv:1810.04805},
  year={2018}
}

Notice: Toshi Stats Co., Ltd. and I do not accept any responsibility or liability for loss or damage occasioned to any person or property through using materials, instructions, methods, algorithm or ideas contained herein, or acting or refraining from acting as a result of such use. Toshi Stats Co., Ltd. and I expressly disclaim all implied warranties, including merchantability or fitness for any particular purpose. There will be no duty on Toshi Stats Co., Ltd. and me to correct any errors or defects in the codes and the software


How can we develop machine intelligence with a little data in text analysis?

ginza-725794_1280

Whenever you want to create machine intelligence model, the first question to ask is “Where is my data?”.   It is usually difficult to find good data to create models because it is time-consuming and may require costs to do that. Unless you work in good companies such as Google or Facebook, it might be a headache for you. But fortunately, there are good ways to solve this problem. It is “Transfer learning”.  Let us find out!

1. Transfer learning

When we need to train machine intelligence models, we usually use “supervised learning”. It means that we need “teachers” who can tell which is a right answer. For example, when we need to classify “which is a cat or a dog?”, we need to tell “this is a cat and that is a dog” to computers.  It is the powerful method of learning to achieve higher accuracy.  So most of the current AI applications are developed by “Supervised learning”.  But a problem arises here. There are a little data for supervised learning.  While we have many images on our smartphones, each image has no information about “what it is”. So we need to add this information to each image manually.  It takes time to complete as a massive amount of images are needed in training. I explained it a little in computer vision in my blog before. We can say the same thing in text analysis or natural language processing. We have many tweets on the internet. But no one tells you which has positive and negative sentiment. Therefore we need to put “positive or negative’ to each tweet by ourselves. No one wants to do that. Then “Transfer learning” comes here.  You do not need training from scratch. Just transfer someone’s results to your models as someone did the similar training before you do!  The beauty of “Transfer Learning” is that we need just a little data in our training. No need for a massive amount of data anymore. It makes preparing data far easier for us!

Cat and dogs

2. “Transformer”

This model (1) is one of the most sophisticated models for machine translation in 2017. It is created by Google brain. As you know, it achieved the state of art of accuracy in Neural Machine translation at the time it was public.  The key architecture of Transformer is “Self-attention”.  It can tell us where the model should pay attention to among all words in a sentence, regardless of their respective position, by using “Query, Key, and Value” mechanism. The Research paper “Attention Is All You Need” is available here.  “Self-attention mechanism” takes times to explain in details. If you want to know more, this blog is strongly recommended. I just want to say “Self-attention mechanism” might be a game changer to develop machine intelligence in the future.

3.  Transfer learning based on “Transformer”

It has been more than one year since “Transformer” was public, There are several variations based on”Transformer”.  I found the good model for “transfer learning” I mentioned earlier in this article.  This is “Universal Sentence Encoder“(2).  In this website, we can find a good explanation of what it is.

“The Universal Sentence Encoder encodes text into high dimensional vectors that can be used for text classification, semantic similarity, clustering and other natural language tasks.”

The model takes sentences, phrases or short paragraphs and outputs vectors to be fed into the next process. “The universal-sentence-encoder-large” is trained with “Transformer” (-light is trained with a different model). The beauty is that Universal Sentence Encoder is already trained by Google and these results are available to perform “transfer learning” by ourselves.  This is great! This chart tells you how it works.

Sentense encoder
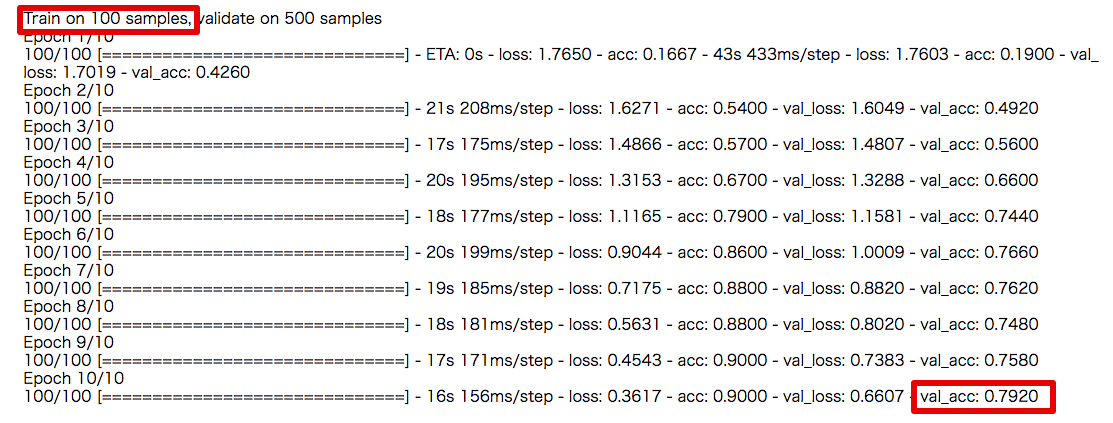
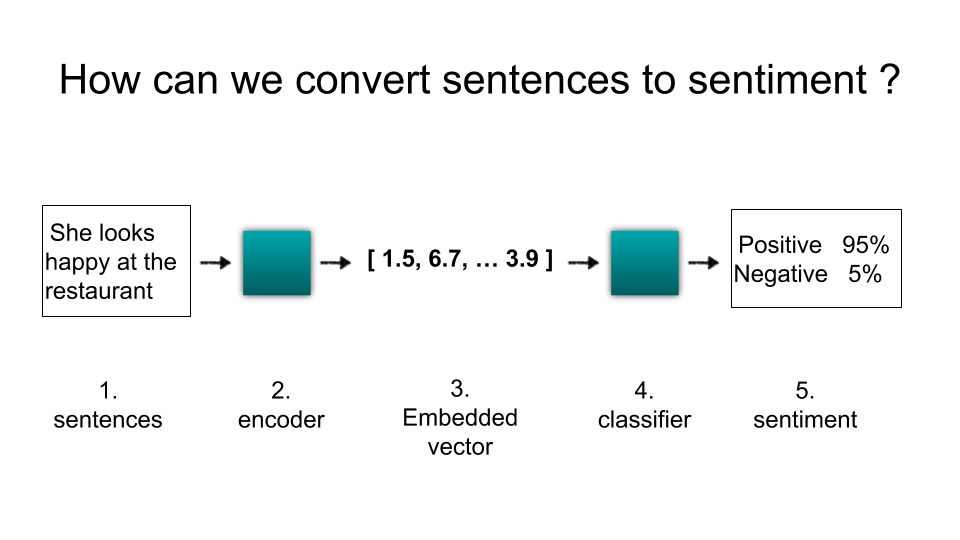
The team in Google claimed that “With transfer learning via sentence embeddings, we observe surprisingly good performance with minimal amounts of supervised training data for a transfer task.”.  So let me confirm how it works with a little data. I performed a small experiment based on this awesome article.  I modify the classification model and change the number of training samples. With only 100 training data,  I could achieve 79.2% accuracy.  With 300 data, 95.8% accuracy. This is great!  I believe the results come from the power of transfer learning with Universal Sentence Encoder.

result1red

In this article, I introduce transfer learning and perform a small experiment with the latest model “Universal Sentence Encoder”.  It looks very promising so far. I would like to continue transfer learning experiments and update the results here.  Stay tuned!


When you need AI consulting,  could you go to  TOSHI STATS website?


  1. Attention Is All You Need,  Ashish Vaswani, Noam Shazeer, Niki Parmar, Jakob Uszkoreit, Llion Jones, Aidan N. Gomez, Lukasz Kaiser, Illia Polosukhin, Google, 12 June 2017.
  2. Universal Sentence Encoder,  Daniel Cer, Yinfei Yang, Sheng-yi Kong, Nan Hua, Nicole Limtiaco, Rhomni St. John, Noah Constant, Mario Guajardo-Cespedes, Steve Yuan, Chris Tar, Yun-Hsuan Sung, Brian Strope, Ray Kurzweil,  Google, 29 March 2018


Notice: Toshi Stats Co., Ltd. and I do not accept any responsibility or liability for loss or damage occasioned to any person or property through using materials, instructions, methods, algorithm or ideas contained herein, or acting or refraining from acting as a result of such use. Toshi Stats Co., Ltd. and I expressly disclaim all implied warranties, including merchantability or fitness for any particular purpose. There will be no duty on Toshi Stats Co., Ltd. and me to correct any errors or defects in the codes and the software


This is my first machine intelligence model. It looks good so far!

DenceNet121_1-1

There are many images on the internet. A lot of people upload selfie-images to Instagram every day.   There are also many text data on the internet because Not only professionals writers but many people express their opinions on blogs and tweets. No one can see every image and text on the internet as it is a huge volume. In addition, images and texts sometimes have a relationship to each other. For example, people upload images and put explanations of them. Therefore I am always wondering how we can analyze both images and text at once.  There are several methods to do that. I choose image-captioning model out of these methods as it is easy to understand how it works.


1. What is an image-captioning model?

Before I start the project on image captioning, I performed computer vision projects and Natural language projects independently.  Computer vision means to classify cats and dogs or detect a specific type of cars and distinguish each of them from other types of cars. I also develop natural language models such as sentiment analysis of movie reviews. Image-captioning model is a kind of combined model of “computer vision and natural language model”.  Let us see the chart below.

image-captioning

A computer takes a picture as input. Then the encoder extracts features from the picture that is taken.  “feature” means the characteristics of an object”. Based on these features, the decoder generates sentences which describes what the picture tells us. This is how our “image-captioning” model works.


2. How can we find the template of “image captioning model” and modify it?

I found a good framework to develop our image-captioning models. It is “colab” provided by Google. Although it is free to use, there are many templates to start with the projects and GPU is available in it for research/interaction usages. It can provide us with a computational power to be required for developing image-captioning models. I found the original template of image-captioning in colab. The template is awesome as “the attention mechanism” is implemented. It uses inceptionV3 as an encoder and GRU as a decoder. But I would like to try other methods. I modify this template a little to change from inceptionV3 to densenet121 and from GRU to LSTM.  Let us see how it works on my experiment!


3. The results after 3-hour-training

Here is one of the outputs from my experiment of our image-captioning model. It says “a couple of two sugar covered in chocolate frosting are laid on top of a wooden table”. Although it is not perfect, it works very well.  When we input more data and computation time, it should be more accurate.

DenceNet121_1-2


This is the first step toward machine intelligence.  Of course, it is a long way to go.  But the combined images and texts, I believe we can develop many cool applications in the future. In addition, I found that “the attention mechanism” is very powerful to extract relevant information. I would like to focus on this mechanism to improve our algorithms going forward. Stay tuned!


(1) Olah&Carter, “Attention and Augmented Recurrent Neural Networks“, Distill, 2016.


When you need AI consulting,  could you see TOSHI STATS website?

Notice: Toshi Stats Co., Ltd. and I do not accept any responsibility or liability for loss or damage occasioned to any person or property through using materials, instructions, methods, algorithm or ideas contained herein, or acting or refraining from acting as a result of such use. Toshi Stats Co., Ltd. and I expressly disclaim all implied warranties, including merchantability or fitness for any particular purpose. There will be no duty on Toshi Stats Co., Ltd. and me to correct any errors or defects in the codes and the software