Graph Neural Networks are very flexible to design models for data analysis

Last time, I introduced Graph Neural Networks (GNN) as a main model to analyze complex data. Let us see how GNN works in detail.

1. What Does Graph Data Look like?

Unlike tabular data, the graph has edges between nodes. It is very interesting because many things have inter relationship with each other, such as…

  • Investors behavior are affected each other in financial markets
  • Rumors are spread and impact people’s decisions in social network
  • Consumers may like the products which are already popular in the market
  • One marketing strategy affects the results of other marketing strategies in the company
  • In the board game called “Go”, some part of results affect other parts of results on Go board

These structures are shown just like the graph below. It is based on the karate club data(1). Each node means each member in the club. The graph(2) shows us four groups in the club. There are edges between nodes and these structures are very important in analyzing data.

2. How can GNN models be trained?

Each node is expressed as vectors (example : [0 1 0 0 5]). It is called “node features” or just “features” in machine learning. When models are trained, each node takes the information from neighbors and is updated based on this information. Yes, it looks simple! One of the ways to take the info from neighbors is the “sum” of information from neighbors. Another is to take the average. We iterate these updates until the loss function can be converged.

It is noted that we can sum up or take the average in the same manner even if the structures of the graph are changed. This is why GNN is very flexible to design the models. 

3. How can the predictions from GNN models be obtained?

After training of models, we can obtain predictions based on the graph. In GNN, there are three kinds of predictions.

  • node prediction : Each node should be classified according to labels. For example, in the Karate club above, each member should be classified as the member in one of the four teams shown in the chart above.
  • graph prediction : Based on the whole structure of the graph, it should be classified. For example, a new antibiotic may be classified whether it works well or not for treatments against certain diseases.
  • link prediction : When each node means each customer or each product, the edges between customers and products can mean the purchase in the past. If we can create better node features based on graph structures, recommendations can be provided to inform which products you may like more accurately.

Hope you can understand how GNN works well. It is very flexible to design. Next, I would like to explain what kind of GNN models are popular in the industries. Stay tuned!

(1) Wayne W. Zachary. An information flow model for conflict and fission in small groups. Journal of
anthropological research, pp. 452–473, 1977.

(2) SEMI-SUPERVISED CLASSIFICATION WITH GRAPH CONVOLUTIONAL NETWORKS, 22 Feb 2017, Thomas N. Kipf & Max Welling

Notice: ToshiStats Co., Ltd. and I do not accept any responsibility or liability for loss or damage occasioned to any person or property through using materials, instructions, methods, algorithms or ideas contained herein, or acting or refraining from acting as a result of such use. ToshiStats Co., Ltd. and I expressly disclaim all implied warranties, including merchantability or fitness for any particular purpose. There will be no duty on ToshiStats Co., Ltd. and me to correct any errors or defects in the codes and the software.

BERT performs very well in the classification task in Japanese, too!

As I promised in the last article, I perform experiments about classification of news title in Japanese. The result is very good as I expected. Let me explain the details.

I use “livedoor news corpus” (2) for this experiment. These are five-class of news title in this experiment. These are about life, movie, sports, chats, and electronics. Here is the detail of the class. I would like to classify each title of news according to this class correctly.

Then I train BERT(1) model with a sample of news title written in Japanese. Here is the result. The BERT model, which I used, is the multi-language model. All I have to do is fine-tuning to apply my task. As you can see below, The accuracy ratio is about 88%. It is very good while I use very small sample data (3503 for training, 876 for test). It took less than one minute on colab with GPU.

With 3 epochs, I confirmed that the accuracy ratio is over 88%

Let me take 10 samples for validation and see each of them. These samples are not used for training so they are new to the computer. Nine out of ten are classified correctly. It is so good, isn’t it?

The beauty is that the pre-trained model is not specific for only Japanese. As it is a multi-language model, it should work in many kinds of languages with the same fine-tuning as I did in Japanese. Therefore It should work in your languages, too!

How about this experiment? I continue to do experiments of BERT in many tasks of natural language and update my article soon. Stay tuned!

  1. BERT: Pre-training of Deep Bidirectional Transformers for Language Understanding
    11 Oct 2018, Jacob Devlin Ming-Wei Chang Kenton Lee Kristina Toutanova, Google AI Language
  2. livedoor news corpus CC BY-ND 2.1 JP

Notice: Toshi Stats Co., Ltd. and I do not accept any responsibility or liability for loss or damage occasioned to any person or property through using materials, instructions, methods, algorithm or ideas contained herein, or acting or refraining from acting as a result of such use. Toshi Stats Co., Ltd. and I expressly disclaim all implied warranties, including merchantability or fitness for any particular purpose. There will be no duty on Toshi Stats Co., Ltd. and me to correct any errors or defects in the codes and the software

Let us develop car classification model by deep learning with TensorFlow&Keras

taxi-1209542_640
For nearly one year, I have been using TensorFlow and considering what I can do with it. Today I am glad to announce that I developed my computer vision model trained by real-world images. This is classification model for automobiles in which 4 kinds of cars can be classified. It is trained by little images on a normal laptop like Mac air. So you can re-perform it without preparing extra hardware.   This technology is called “deep learning”. Let us start this project and go into deeper now.


1. What should we classify by using images?

This is the first thing we should consider when we develop the computer vision model. It depends on the purpose of your businesses. When you are in health care industry,  it may be signs of diseases in human body.  When you are in a manufacture, it may be images of malfunctions parts in plants. When you are in the agriculture industry, Conditions of farm land should be classified if it is not good. In this project, I would like to use my computer vision model for urban-transportations in near future.  I live in Kuala Lumpur, Malaysia.  It suffers from huge traffic jams every day.  The other cities in Asean have the same problem. So we need to identify, predict and optimize car-traffics in an urban area. As the fist step, I would like to classify four classes of cars in images by computers automatically.


2. How can we obtain images for training?

It is always the biggest problem to develop computer vision model by deep learning.  To make our models accurate, a massive amount of images should be prepared. It is usually difficult or impossible unless you are in the big companies or laboratories.  But do not worry about that.  We have a good solution for the problem.  It is called “pre-trained model”. This is the model which is already trained by a huge amount of images so all we have to do is just adjusting our specific purpose or usage in the business. “Pre-trained model” is available as open source software. We use ResNet50 which is one of the best pre-trained models in computer vision. With this model, we do not need to prepare a huge volume of images. I prepared 400 images for training and 80 images for validation ( 100 and 20 images per class respectively).  Then we can start developing our computer vision model!


3.  How can we keep models accurate to classify the images

If the model provides wrong classification results frequently, it must be useless. I would like to keep accuracy ratio over 90% so that we can rely on the results from our model.  In order to achieve accuracy over 90%,  more training is usually needed.  In this training, there are 20 epochs, which takes around 120 minutes to complete on my Mac air13. You can see the progress of the training here.  This is done TensorFlow and Keras as they are our main libraries for deep learning.  At 19th epoch, highest accuracy (91.25%) are achieved ( in the red box). So The model must be reasonably accurate!

Res 0.91


Based on this project,  our model, which is trained with little images,  can keep accuracy over 90%.  Although whether higher accuracy can be achieved depends on images for training,  90% accuracy is good to start with more images to achieve 99% accuracy in future. When you are interested in the classification of something, you can start developing your own model as only 100 images per class are needed for training. You can correct them by yourselves and run your model on your computer.  If you need the code I use,  you can see it here. Do you like it? Let us start now!


Notice: TOSHI STATS SDN. BHD. and I do not accept any responsibility or liability for loss or damage occasioned to any person or property through using materials, instructions, methods, algorithm or ideas contained herein, or acting or refraining from acting as a result of such use. TOSHI STATS SDN. BHD. and I expressly disclaim all implied warranties, including merchantability or fitness for any particular purpose. There will be no duty on TOSHI STATS SDN. BHD. and me to correct any errors or defects in the codes and the software

Can your computers see many objects better than you in 2017 ?

notebook-1757220_640

Happy new year for everyone.  I am very excited that new year comes now. Because this year, artificial intelligence (AI) will be much closer and closer to us in our daily lives. Smartphones can answer your questions with accuracy. Self-driving car can run without human drivers. Many AI game players can compete human players, and so on. It is incredible, isn’t it!

However, in most cases,  these programs of many products are developed by giant IT companies, such as Google and Microsoft. They have almost unlimited data and computer resources so it is possible to make better programs. How about us?  we have small data and limited computer resources unless we have enough budget to use cloud services. Is it  difficult to make good programs in our laptop computers by ourselves?  I do not think so. I would like to try it by myself first.

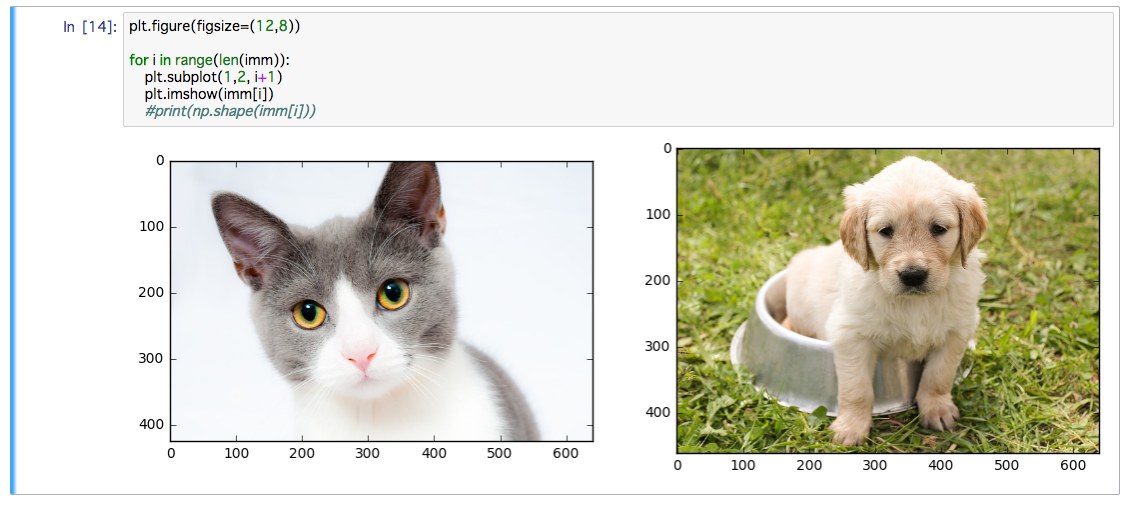
I would like to make program to classify cats and dogs in images. To do that, I found a good tutorial (1). I use the code of this tutorial and perform my experiment. Let us start now. How can we do that?  It is amazing.

cats-and-dogs

For building the AI model to classify cats and dogs, we need many images of cats and dogs. Once we have many data, we should train the model so that the model can classify cats and dogs correctly.  But we have two problems to do that.

1.  We need massive amount of images data of  cats and dogs

2. We need high-performance computer resources like GPU

To train the models of artificial intelligence,  it is sometimes said ” With massive amount of data sets,  it takes several days or one week to complete training the models”. In many cases, we can not do that.  So what should we do?

Do not worry about that. We do not need to create the model from scratch.  Many big IT companies or famous universities have already trained the AI models and make them public for everyone to use. It is sometimes called “pre-trained models”. So all we have to do is just input the results from pre-trained model and make adjustments for our own purposes. In this experiment,  our purpose is to identify cats and dogs by computers.

I follow the code by François Chollet, creator of keras. I run it on my MacAir11. It is normal Mac and no additional resources are put in it. I prepared only 1000 images for cats and dogs respectively. It takes 70 minutes to train the model.  The result is around 87% accuracy rate. It is great as it is done on normal laptop PC, rather than servers with GPU.


Based on the experiment, I found that Artificial intelligence models can be developed on my Mac with little data to solve our own problem. I would like to perform more tuning to obtain more accuracy rate . There are several methods to make it better.

Of course, this is the beginning of story. Not only “cats and dogs classifications’ but also many other problems can be solved in the way I experiment here. When pre-trained models are available, they can provide us great potential abilities to solve our own problems. Could you agree with that?  Let us try many things with “pre-trained model” this year!


1.Building powerful image classification models using very little data

https://blog.keras.io/building-powerful-image-classification-models-using-very-little-data.html

Notice: TOSHI STATS SDN. BHD. and I do not accept any responsibility or liability for loss or damage occasioned to any person or property through using materials, instructions, methods, algorithm or ideas contained herein, or acting or refraining from acting as a result of such use. TOSHI STATS SDN. BHD. and I expressly disclaim all implied warranties, including merchantability or fitness for any particular purpose. There will be no duty on TOSHI STATS SDN. BHD. and me to correct any errors or defects in the codes and the software

This is our new platform provided by Google. It is amazing as it is so accurate!

cheesecake-608963_640

In Deep learning project for digital marketing,  we need superior tools to perform data analysis and deep learning.  I have watched “TensorFlow“, which is an open source software provided by Google since it was published on Nov 2015.   According to one of the latest surveys by  KDnuggets, “TensorFlow” is the top ranked tool for deep learning (H2O, which our company uses as main AI engine, is also getting popular)(1).

I try to perform an image recognition task with TensorFlow and ensure how it works. These are results of my experiment. MNIST, which is hand written digits from 0 to 9, is used for the experiment. I choose convolutional network to perform it.  How can TensorFlow can classify them correctly?

MNIST

I set the program of TensorFlow in jupyter like this. This comes from tutorials of TensorFlow.

MNIST 0.81


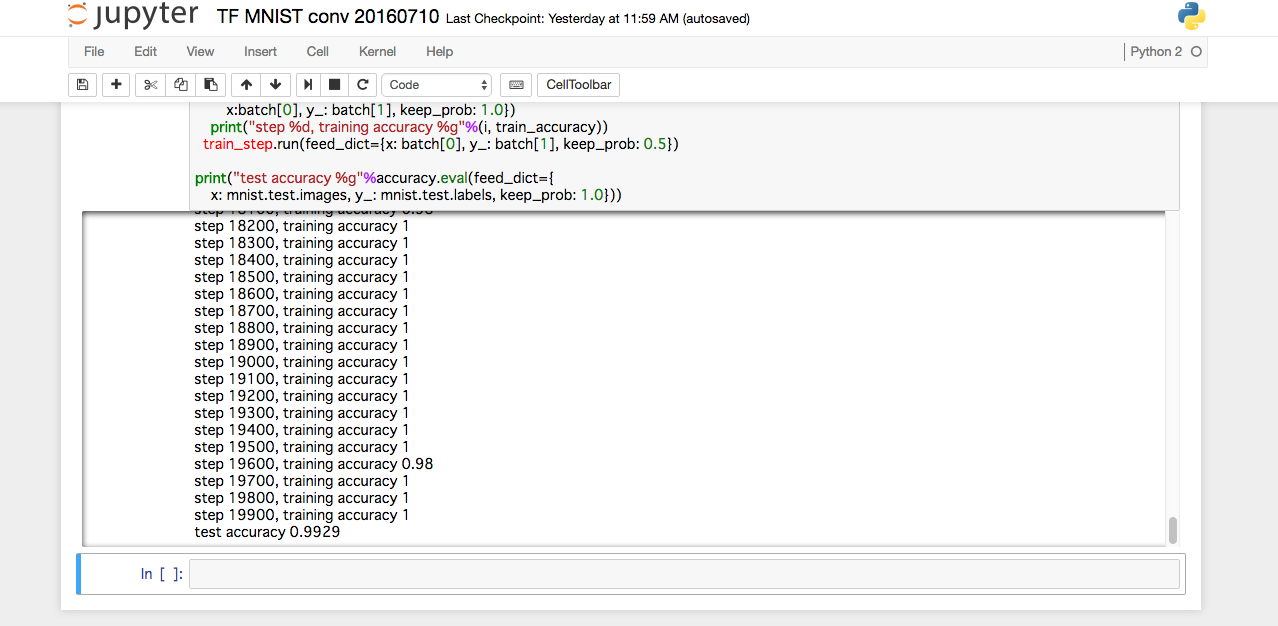
This is the result . It is obtained after 80-minute training. My machine is MAC air 11 (1.4 GHz Intel Core i5, 4GB memory)

MNIST 0.81 3

Could you see the accuracy rate?  Accuracy rate is 0.9929. So error rate is just 0.71%!  It is amazing!

MNIST 0.81 2r

Based on my experiment, TensorFlow is an awesome tool for deep learning.  I found that many other algorithms, such as LSTM and Reinforcement learning, are available in TensorFlow. The more algorithms we have,  the more flexible our strategy for solutions of digital marketing can be.


We obtain this awesome tool to perform deep learning. From now we can analyze many data with TensorFlow.  I will provide good insights from data in the project to promote digital marketing. As I said before “TensorFlow” is open source software. It is free to use in our businesses.  No fees is required to pay. This is a big advantage for us!

I can not say TensorFlow is a tool for beginners as it is a computer language for deep leaning. (H2O can be operated without programming by GUI). If you are familiar with Python or similar languages, It is for you!  You can download and use it without paying any fees. So you can try it by yourself. This is my strong recommendation!


TensorFlow: Large-scale machine learning on heterogeneous systems

1 : R, Python Duel As Top Analytics, Data Science software – KDnuggets 2016 Software Poll Results

http://www.kdnuggets.com/2016/06/r-python-top-analytics-data-mining-data-science-software.html


Notice: TOSHI STATS SDN. BHD. and I do not accept any responsibility or liability for loss or damage occasioned to any person or property through using materials, instructions, methods, algorithm or ideas contained herein, or acting or refraining from acting as a result of such use. TOSHI STATS SDN. BHD. and I expressly disclaim all implied warranties, including merchantability or fitness for any particular purpose. There will be no duty on TOSHI STATS SDN. BHD. and me to correct any errors or defects in the codes and the software.


“DEEP LEARNING PROJECT for Digital marketing” starts today. I present probability of visiting the store here

cake-623579_640

At the beginning of this year,  I set up a new project of my company.  The project is called “Deep Learning project” because “Deep Learning” is used as a core calculation engine in the project. Now that I have set up the predictive system to predict customer response to a direct mailing campaign, I would like to start a sub-project called  “DEEP LEARNING PROJECT for Digital marketing”.  I think the results from the project can be applied across industries, such as healthcare, financial, retails, travels and hotels, food and beverage, entertainments and so on. First, I would like to explain how to obtain probability for each customer to visit the store in our project.


1. What is the progress of the project so far?

There are several progresses in the project.

  • Developing the model to obtain the probability of visiting the store
  • Developing the scoring process to assign the probability to each customer
  • Implement the predictive system by using Excel as an interface

Let me explain our predictive system. We constructed the predictive system on the platform of  Microsoft Azure Machine Learning Studio. The beauty of the platform is Excel, which is used by everyone, can be used as an interface to input and output data. This is our interface of the predictive system with on-line Excel. Logistic regression in MS Azure Machine Learning is used as our predictive model.

The second row (highlighted) is the window to input customer data.

Azure ML 1

Once customer data are input, the probability for the customer to visit the store can be output. (See the red characters and number below). In this case (Sample data No.1) the customer is less likely to visit the store as Scored  Probabilities is very low (0.06)

Azure ML 3


On the other hand,  In the case (Sample data No.5) the customer is likely to visit the store as Scored Probabilities is relatively high (0.28). If you want to know how it works, could you see the video?

Azure ML 2

Azure ML 4


2. What is the next in our project?

Once we create the model and implement the predictive system, we are going to the next stage to reach more advanced topics

  • More marketing cases with variety of data
  • More accuracy by using many models including Deep Learning
  • How to implement data-driven management


Our predictive system should be more flexible and accurate. In order to achieve that, we will perform many experiments going forward.


3. What data is used in the project?

There are several data to be used for digital marketing. I would like to use this data for our project.

When we are satisfied with the results of our predictions by this data,  next data can be used for our project.


Digital marketing is getting more important to many industries from retail to financial.   I will update the article about our project on a monthly basis. Why don’t you join us and enjoy it!  When you have your comments or opinions, please do not hesitate to send us!

If you want to receive update of the project or want to know the predictive system more, could you sing up here?


Microsoft, Excel and AZURE are either registered trademarks or trademarks of Microsoft Corporation in the United States and/or other countries.

Notice: TOSHI STATS SDN. BHD. and I do not accept any responsibility or liability for loss or damage occasioned to any person or property through using materials, instructions, methods, algorithm or ideas contained herein, or acting or refraining from acting as a result of such use. TOSHI STATS SDN. BHD. and I expressly disclaim all implied warranties, including merchantability or fitness for any particular purpose. There will be no duty on TOSHI STATS SDN. BHD. and me to correct any errors or defects in the codes and the software.

This is No.1 open-online course of “Deep Learning”. It is a new year present from Google!

desk-918425_640

I am very happy to find this awesome course of “Deep Learning” now . It is the course which is provided by Google through Udacity(1), one of the biggest mooc platforms in the world. So I would like to share it to any person who are interested in “Deep Learning”.

It is the first course which explains Deep Learning from Logistic regression to Recurrent neural net (RNN) in the uniformed manner on mooc platform as far as I know. I looked at it and was very surprised how awesome the quality of the course is.  Let me explain more details.


1. We can learn everything from Logistic regression to RNN seamlessly

This course covers many important topics such as logistic regression, neural network,  regularization, dropout, convolutional net, RNN and Long short term memory (LSTM). These topics are seen in some articles independently before. It is however very rare to explain each of them at once in the same place.  This course looks like a story of development of Deep Learning. Therefore, even beginners of Deep Learning can follow the course. Please look at the path of the course. It is taken from the course video of L1 Machine Learning to Deep Learning .

DL path

Especially, explanations of RNN are very easy to understand. So if you do not have enough time to take a whole course, I just recommend to watch the videos of RNN and related topics in the course. I am sure it is worth doing that.


2. Math is a little required, but it is not an obstacle to take this course

This is one of the courses in computer science.  The more you understand math, the more you can obtain insights from the course. However, if you are not so familiar with mathematics, all you have to do is to overview basic knowledge of “vectors”, “matrices” and “derivatives”.  I do not think you need to give up the course because of the lack of knowledge of math. Just recall high school math, then you can start this awesome course!


3. “Deep learning” can be implemented with “TensorFlow“, which is open source provided by Google

This is the most exciting part of the course if you are developers or programmers.  TensorFlow is a  python-based language. So many developers and programmers can be familiar with TensorFlow easily.  In the program assignments, participants can learn from simple neural net to sequence to sequence net with TensorFlow. It must be good! While I have not tried TensorFlow programming yet, I would like to do that in the near future. It is worth doing that even though you are not programmers. Let us challenge it!


In my view,  Deep Learning for sequence data is getting more important as time series data are frequently used in economic analysis,  customer management and internet of things.   Therefore, not only data-scientists, but also business personnel, company executives can benefit from this course.  It is free and self-paced when you watch the videos. If you need a credential, small fee is required. Why don’t you try  this awesome course?


(1) Deep Learning on Udacity

https://www.udacity.com//course/viewer#!/c-ud730/l-6370362152/m-6379811815


Notice: TOSHI STATS SDN. BHD. and I do not accept any responsibility or liability for loss or damage occasioned to any person or property through using materials, instructions, methods, algorithm or ideas contained herein, or acting or refraining from acting as a result of such use. TOSHI STATS SDN. BHD. and I expressly disclaim all implied warranties, including merchantability or fitness for any particular purpose. There will be no duty on TOSHI STATS SDN. BHD. and me to correct any errors or defects in the codes and the software.


Do you know how computers can read e-mails instead of us?

email-329819_1280

Hello, friends. I am Toshi. Today I update my weekly letter. This week’s topic is “e-mail”.   Now everyone uses email to communicate with customers, colleagues and families. It is useful and efficient. However, if you try to read massive amounts of e-mails at once manually, it takes a lot of time.  Recently, computers can read e-mail and classify potentially relevant e-mail from others instead of us. So I am wondering how computers can do that. Let us consider it a little.

1.  Our words can become “data”

When we hear the word “data”,  we imagine numbers in spreadsheets.  This is a kind of “traditional” data.  Formally, it is called “structured data”. On the other hand, text such as words in e-mail, Twitter, Facebook can be “data”, too.  This kind of data is called “unstructured data“. Most of our data exist as “unstructured data” around us.  However, computers can transform these data into data that can be analyzed. This is generally an automated process. So we do not need to check each of them one by one. Once we can create these new data, computers can analyze them at astonishing speed.  It is one of the biggest advantages to use computers in analyzing e-mails.

2. Classification comes again

Actually, there are many ways for computers to understand e-mails. These methods are sometimes called Natural language processing (NLP)“.  One of the most sophisticated one is a method using machine learning and understanding the meaning of sentences by looking at the structures of sentences. Here I would like to introduce one of the simplest methods so that everyone can understand how it works.  It is easy to imagine that the “number of each word” can be data.  For example, ” I want to meet you next week.”.  In this case, (I,1), (want,1),(to,1), (meet,1),(you,1), (next,1),(week,1) are data to be analyzed. The longer sentences are, the more words appear as data. For example, we try to analyze e-mails from customers to assess who are satisfied with our products. If the number of positive words, such as like, favorite, satisfy, are high,  it might mean customers are satisfied with the products, vice versa.  This is a problem of “classification“.  So we can apply the same method as I explained before. The “target” is “customers satisfied” or “not satisfied” and “features” are the number of each word. 

3. What’s the impact to businesses?

If computers understand what we said in text such as e-mails,  we can make the most out of it in many fields. For the marketing, we can analyze the voices of customers from the massive amount of e-mails. For the legal services, computers identify what e-mails are potentially relevant as evidences for litigations.  It is called “e-discovery“.  In addition to that, I found that Bank of England started monitoring social networks such as Twitter and Facebook in order to research economies.  This is a kind of “new-wave” of economic analysis.  These are just examples. I think  you can create many examples of applications for businesses by yourself because we are surrounded by a lot of e-mails now.  

In my view, natural language processing (NLP) will play a major role in the digital economy.   Would you like to exchange e-mail with computers?

Now I challenge the competition of data analysis. Could you join with us?

public-domain-images-free-stock-photos-high-quality-resolution-downloads-nashville-tennessee-21

Hi friends.  I am Toshi.  Today I update the weekly letter.  This week’s topic is about my challenge.  Last Saturday and Sunday I challenged the competition of data analysis in the platform called “Kaggle“. Have you heard of that?   Let us find out what the platform is and how good it is for us.


This is the welcome page of Kaggle. We can participate in many challenges without any fee.  In some competitions,  the prize is awarded to a winner. First, data are provided to be analyzed after registration of competitions.  Based on the data, we should create our models to predict unknown results. Once you submit the result of your predictions,  Kaggle returns your score and ranking in all participants.

K1

In the competition I participated in, I should predict what kind of news articles will be popular in the future.  So “target” is “popular” or “not popular”. You may already know it is “classification” problem because “target” is “do” or “not do”  type. So I decided to use “logistic curve” to predict, which I explained before.  I always use “R” as a tool for data analysis.

This is the first try of my challenge,  I created a very simple model with only one “feature”. The performance is just average.  I should improve my model to predict the results more correctly.

K3

Then I modified some data from characters to factors and added more features to be input.  Then I could improve performance significantly. The score is getting better from 0.69608  to 0.89563.

In the final assessment, the data for predictions are different from the data used in interim assessments. My final score was 0.85157. Unfortunately, I could not reach 0.9.  I should have tried other methods of classification, such as random forest in order to improve the score. But anyway this is like a game as every time I submit the result,  I can obtain the score. It is very exciting when the score is getting improved!

K4


This list of competitions below is for the beginners. Everyone can challenge the problems below after you sign off.  I like “Titanic”. In this challenge we should predict who could survive in the disaster.  Can we know who is likely to survive based on data, such as where customers stayed in the ship?  This is also “classification”problem. Because the “target” is “survive”or “not survive”.

K2


You may not be interested in data-scientists itself. But it is worth challenging these competitions for everyone because most of business managers have opportunities to discuss data analysis with data-scientists in the digital economy. If you know how data is analyzed in advance, you can communicate with data-scientists smoothly and effectively. It enables us to obtain what we want from data in order to make better business decisions.  With this challenge I could learn a lot. Now it’s your turn!

Do you want to know “how banks rate you when you borrow money from banks”?

singapore-218528_1280

Hi friends,  I am Toshi, This is my weekly letter. This week’s topic is “how banks rate you when you borrow money from banks”. When we want bank loans, it is good that we can borrow the amount of money we need,  with a lower interest.  Then I am wondering how banks decide who can borrow the amount of money requested with lower interests. In other words, how banks assess customer’s credit worthiness.  The answer is “Classification”.  Let me explain more details. To make the story simple,  I take an example of  unsecured loans, loans without collateral.


1.  “Credit risk model” makes judgements to lend

Now many banks prepare their own risk models to assess credit worthiness of customers.  Especially global banks are required to prepare the models by regulators, such as BIS, FSA and central banks. Major regional banks are also promoted to have risk models to assess credit worthiness.  Regulations may differ from countries to countries,  by size of banks.  But it is generally said that banks should have their risk models to enhance credit risk management.  When I used to be a credit risk manager of the Japanese consumer finance company, which is one of  the group companies in the biggest financial group in Japan,  each customer is rated by credit risk models. Good rating means you can borrow money with lower interest. On the other hand, bad rating means you can borrow only limited amount of money with higher interest rate or may be rejected to borrow. From the standpoint of management of banks, it is good because banks can keep consistency of the lending judgements to customers among the all branches.  The less human judgement exists, the more consistency banks keep.  Even though business models may be different according to strategies of banks, the basic idea of the assessment of credit worthiness is the same.


2. “Loan application form” is a starting point of the rating process

So you understand credit risk models play an important role. Next, you may wonder how rating of each customer is provided.  Here “classification” works. Let me explain about this.  When we try to borrow money,  It is required to fill “application forms”. Even though the details of forms are different according to banks,  we are usually asked to fill “age” “job title” “industry” “company name” “annual income” “owned assets and liabilities” and so on.   These data are input into risk models as “features”.   So each customer has a different value of “features”.  For example, someone’s income is high while others income is low.   Then I can say  “Features”of each customer can explain credit worthiness of each customer.   In other words,  credit risk model can “classify”  customers with high credit worthiness and customers with low credit worthiness by using  “features”.


3.  Rating of each customer are provided based on “probability of default

Then let us see how models can classify customers in more details. Each customer has values of “features”  in the application form. Based on the values of “features”, each customer obtains his/her own “one value”.  For example, Tom obtains “-4.9” and Susum obtains “0.9” by adding “features” multiplied with “its weight”.  Then we can obtain “probability of default” for each customer.  “Probability of default” means the likelihood where the customer will be in default in certain period, such as one year. Let us see Tom’s case. According to the graph below,  Tom’s probability of default, which is shown in y-axis, is close to 0.  Tom has a low “probability of default”. It means that he is less likely to be in default in the near term. In such a case,  banks provide a good rating to Tom. This curve below is called “logistic curve” which I explained last week. Please look at my week letter on 23 April.

logistic2

Let us see Susumu’s case. According to the graph below,  Susumu’s probability of default, which is shown in y-axis, is around 0.7, 70%.  Susumu has a high probability of default. It means that he is likely to be in default in the near term. In such a case,  banks provide a bad rating to Susumu. In summary,  the lower probability of default is,  the better rating is provided to customers.


logistic1

Although there are other methods  of “classification”,  logistic curve is widely used in the financial industry as far as I know. In theory, the probability of default can be obtained for many customers from individuals to big company and sovereigns, such as “Greeks”.  In practice, however, more data are available in loans to individuals and small and medium size enterprises (SME) than loans to big companies.  The more data are available, the more accurately banks can assess credit worthiness. If there are few data about defaults of customers in the past,  it is difficult to develop credit risk models effectively. Therefore, risk models of individuals and SMEs might be easier than risk models of big companies as more data are usually available in loans to individuals and SMEs.

I hope you can understand the process to rate customers in banks. Data can explain our credit worthiness, maybe better than we do. Data about us is very important when we try to borrow money from banks.