These are small Christmas presents for you. Thanks for your support this year!

christmas-present-83119_640i

I started the group of “big data and digital economy” in Linked in on 15th April this year. Now the participants are over 300 people!  This is beyond my initial expectation. So I would like to appreciate all of you for your support.

I prepare several small Chirstmas presents here. If you are interested in, please let me know. I will do my best!


1. Your theme of my weekly letter

As you know, I write the weekly letter “big data and digital economy” every week and publish it in Linkedin. If you are interested in specific themes,  I would like to research and write them as long as I can. Anything is OK if it is about digital economy.  Please let me know!


2.  Applications of data analysis in 2016

In 2016,  I would like to develop my applications using data analysis and make them public through the internet.  As long as data is “public”,  we can do any analysis on the data. Therefore,  if you would like to look at your own analysis based on public data,  could you let me know what you are interested in?    These are examples of applications provided by “shiny”,  very famous tool among data scientists.

http://shiny.rstudio.com/gallery/


3.   Announcement on the  project of R-programming platform

This is a project of my company in 2016.  To support for business personnel to learn R-programming,  I would like to set up the platform where participants can learn R-programming interactively with ease.  Contents are very important in order for participants to keep learning motivations. When you have specific themes which you want to learn,  could you let me know?  These themes may be included as programs in the platform going forward!    This is an introductory video of the platform.

http://www.toshistats.net/r-programming-platform/


Thanks for your support in 2015 and let us enjoy predictive analytics in 2016!

“Community” accelerates the progress of machine learning all over the world!

cake-1005760_1280

When you start learning programming,  it is recommended to visit the sites of community of languages.  “R” and “python” have big communities, and they have been contributing to the progress of each language. This is good for all users. H2O. ai also held an annual community conference “H2O WORLD 2015”  this month.  Now video and presentation slides are available through the internet. I could not attend the conference as it was held in Silicon Valley in the US. But I can follow and enjoy it just by going through websites. I recommend you to have a quick look to understand how knowledge and experiences can be shared at the conference. It is good for anyone who are interested in data analysis.


1.  The user communities can accelerate the progress of open source languages

When I started learning “MATLAB®” in 2001,  there were few user communities in Japan as far as I knew.  So I should attend the paid seminars to learn this language, which were not cheap.  But now most of uses communities are available without any fee. In addition to that,  this kind of communities have been bigger and bigger recently.   One of the main reasons is that number of “open source languages” are increasing recently.    “R” and “python” are also open source languages. It means that when someone want to try certain language,  all they have to do is just “download  and use it”.  Therefore, users can be increased at an astonishing pace.  On the other hand,  if someone want to try “proprietary software” such as MATLAB, they must buy each license before using it. I loved MATLAB for many years and recommended my friends to use it. But unfortunately no one uses it privately because it is difficult to pay license fee privately.  I imagine that most users of proprietary software are in organizations such as companies and universities.  In such case, organizations pay license fees.  So each individual can enjoy no freedom to choose languages they want to use. Generally it is difficult to switch from one language to another when proprietary softwares are used. It is called “Vendor lock-in“.  Open source languages can avoid that. This is one of the reasons why I love open source languages now. The more people can use, the more progress can be achieved.  New technologies such as “machine learning” can be developed thought user communities because more users will join going forward.


2.  The real industry experiences can be shared in communities

It is the most exciting part of the community.  As a lot of data scientists and engineers from industry join communities,  their knowledge and experience are shared frequently.  It is difficult to find this kind of information in other places.  For example, the theory of algorithms and methods of programming can be found in the courses provided by universities in MOOCs. But there are few about industry experiences in MOOCs in a real time basis.  For example, in H2O WORLD 2015,  there are sessions with many professionals and CEOs from industries. They share their knowledge and experiences there.  It is a treasure not only for experts of data analysis, but for business personnel who are interested in data analysis. I would like to share my own experience in user communities in future.


3.  Big companies are supporting uses communities

Recently major IT big companies have noticed the importance of the user community and try to support them.  For example, Microsoft supports “R Consortium” as a platinum member. Google and Facebook support communities of their open source languages, such as “TensorFlow” and “Torch“.  Because new things are likely to happen and be developed among users outside the companies.  Therefore It is also beneficial to big IT companies when they support user communities. Many other IT companies are supporting communities, too. You can find many names as sponsors under the big conference of user communities.


The next big conference of user communities is “useR! – International R User Conference 2016“.  It will be held on June 2016.  Why don’t you join us?  You may find a lof of things there. It must be exciting!


Note: Toshifumi Kuga’s opinions and analyses are personal views and are intended to be for informational purposes and general interest only and should not be construed as individual investment advice or solicitation to buy, sell or hold any security or to adopt any investment strategy.  The information in this article is rendered as at publication date and may change without notice and it is not intended as a complete analysis of every material fact regarding any country, region market or investment.

Data from third-party sources may have been used in the preparation of this material and I, Author of the article has not independently verified, validated such data. I and TOSHI STATS.SDN.BHD. accept no liability whatsoever for any loss arising from the use of this information and relies upon the comments, opinions and analyses in the material is at the sole discretion of the user. 

This is my first “Deep learning” with “R+H2O”. It is beyond my expectation!

dessert-352475_1280

Last Sunday,  I tried “deep learning” in H2O because I need this method of analysis in many cases. H2O can be called from R so it is easy to integrate H2O into R. The result is completely beyond my expectation. Let me see in detail now!

1. Data

Data used in the analysis is ” The MNIST database of handwritten digits”. It is well known by data-scientists because it is frequently used to validate statistical model performance.  Handwritten digits look like that (1).

MNIST

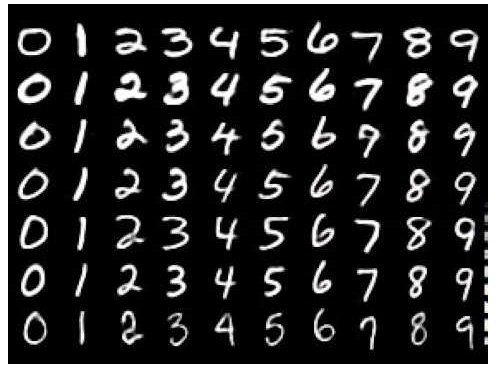
Each row of the data contains the 28^2 =784 raw grayscale pixel values from 0 to 255 of the digitized digits (0 to 9). The original data set of The MNIST is as follows.

  • Training set of 60,000 examples,
  • Test set of 10,000 examples.
  • Number of features is 784 (28*28 pixel)

The data in this analysis can be obtained from the website (Training set of 19,000 examples, Test set of 10,000 examples).


2. Developing models

Statistical models learn by using training set and predict what each digit is by using test set.  The error rate is obtained  as “number of wrong predictions /10,000″. The world record is ” 0.83%”  for models without convolutional layers, data augmentation (distortions) or unsupervised pre-training (2). It means that the model has only 83 error predictions in 10,000 samples.

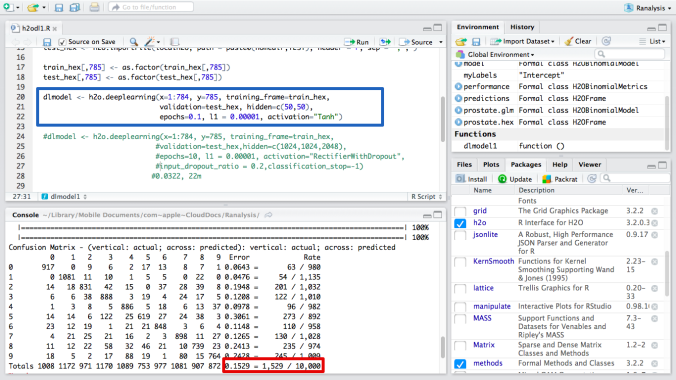
This is an image of RStudio, IDE of R.  I called H2O from R and write code “h2o.deeplearning( )”.  The detail is shown in the blue box below.  I developed the model with 2 layers and 50 size for each. The error rate is 15.29% (in the red box).  I need more improvement of the model.

DL 15.2

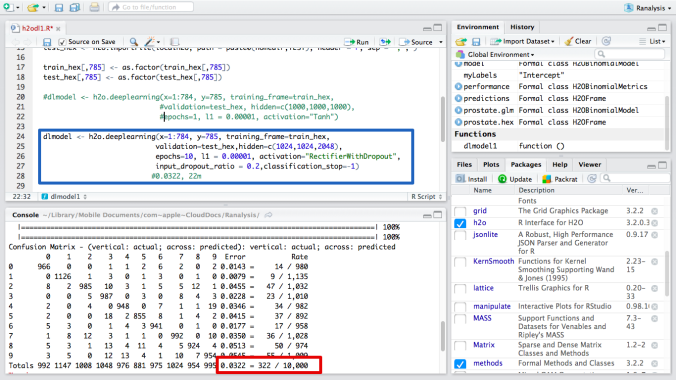
Then I increase the number of layers and sizes.  This time,   I developed the model with 3 layers and 1024, 1024, 2048 size for each. The error rate is 3.22%, much better than before (in the red box).  It took about 23 minutes to be completed. So there is no need to use more high-power machines or clusters so far ( I use only my MAC Air 11 in this analysis). I think I can improve the model more if I tune parameters carefully.

DL 3.2

Usually,  Deep learning programming is a little complicated. But H2O enable us to use deep learning without programming when graphic user interface “H2O FLOW” is used.  When you would like to use R,   the command of deep learning to call H2O  is similar to the commands for linear model (lm) or generalized linear model (glm) in R. Therefore, it is easy to use H2O with R.


This is my first deep learning with R+H2O. I found that it could be used for a variety cases of data analysis. When I cannot be satisfied with traditional methods, such as logistic regression, I can use deep learning without difficulties. Although it needs  a little parameter tuning such as number of layers and sizes,  it might bring better results as I said in my experiment. I would like to try “R+H2O” in Kaggle competitions, where many experts compete for the best result of predictive analytics.


P.S.

The strongest competitor to H2O appears on 9 Nov 2015.  This is ” TensorFlow” from Google.  Next week,  I will report this open source software.


Source

1. The image from GitHub  cazala/mnist

https://github.com/cazala/mnist

2. The Definitive Performance Tuning Guide for H2O Deep Learning , Arno Candel, February 26, 2015

http://h2o.ai/blog/2015/02/deep-learning-performance/


Note: Toshifumi Kuga’s opinions and analyses are personal views and are intended to be for informational purposes and general interest only and should not be construed as individual investment advice or solicitation to buy, sell or hold any security or to adopt any investment strategy.  The information in this article is rendered as at publication date and may change without notice and it is not intended as a complete analysis of every material fact regarding any country, region market or investment.

Data from third-party sources may have been used in the preparation of this material and I, Author of the article has not independently verified, validated such data. I and TOSHI STATS.SDN.BHD. accept no liability whatsoever for any loss arising from the use of this information and relies upon the comments, opinions and analyses in the material is at the sole discretion of the user. 

Can you be next “Mark Zuckerberg” with open source software?

coffee-563797_640

I like open source software because it is  almost free to use,  modify and distribute. For example,  I use “R language” for data analysis as I can share code to anyone without cost.  R is an example of open source software. When I used to be a risk manager more than 10 years ago, I used MATLAB.  This is an awesome software for data analysis. However, we need to buy a license to use it. So I cannot recommend it for everyone.  But I can do that for R as it is free.


Open source software is strong enough to change the landscape of developing computer programs. Especially I look at the movement driven by Facebook, it looks like a big tsunami to take over the industry. It has more than 200 open source software projects from mobile application development to artificial intelligence according to the article. Mark Zuckerberg,  Founder and CEO of Facebook, have been taking initiative open source movement for many years.  For new start-up, it is very good and helpful because


1.  It accelerates development of applications

Because startups usually do not have enough resources to develop the applications from scratch, it is very helpful for them to use open source software. All they should do is modify the software to make applications. Facebook is also built by using open source software, although it becomes one of the biggest IT companies in the world.


2. There are more choices provided by open source softwares

When there are several kinds of open sources for specific purposes, we can choose the best one for our own purpose. All we should do is  to assess each of them.  For example, when you are interested in artificial intelligence, there are many major open source softwares,  such as TheanoPylearn2Torch, OpenDeep, Chainer and so on.  Each of them is a little different in terms of functionality and structures. Therefore, we should choose the best one for our own purpose. When we have the best choice. it allows us to develop applications rapidly and effectively.


3.  Open source softwares can lower the entrance barriers

It is usually difficult for start-ups to develop complex programs, such as deep learning, from scratch. But supported by open source software, start-ups can learn and develop the applications at the same time. It is very important in the digital economy as the supply of experts in such fields are always less than the demands in labor markets.


Going forward, I would like to develop an economic analysis system by using open source software and make it available for everyone who is interested in.  I hope everyone can analyze the economy in his/her own country by him/herself in the business.

Now I challenge the competition of data analysis. Could you join with us?

public-domain-images-free-stock-photos-high-quality-resolution-downloads-nashville-tennessee-21

Hi friends.  I am Toshi.  Today I update the weekly letter.  This week’s topic is about my challenge.  Last Saturday and Sunday I challenged the competition of data analysis in the platform called “Kaggle“. Have you heard of that?   Let us find out what the platform is and how good it is for us.


This is the welcome page of Kaggle. We can participate in many challenges without any fee.  In some competitions,  the prize is awarded to a winner. First, data are provided to be analyzed after registration of competitions.  Based on the data, we should create our models to predict unknown results. Once you submit the result of your predictions,  Kaggle returns your score and ranking in all participants.

K1

In the competition I participated in, I should predict what kind of news articles will be popular in the future.  So “target” is “popular” or “not popular”. You may already know it is “classification” problem because “target” is “do” or “not do”  type. So I decided to use “logistic curve” to predict, which I explained before.  I always use “R” as a tool for data analysis.

This is the first try of my challenge,  I created a very simple model with only one “feature”. The performance is just average.  I should improve my model to predict the results more correctly.

K3

Then I modified some data from characters to factors and added more features to be input.  Then I could improve performance significantly. The score is getting better from 0.69608  to 0.89563.

In the final assessment, the data for predictions are different from the data used in interim assessments. My final score was 0.85157. Unfortunately, I could not reach 0.9.  I should have tried other methods of classification, such as random forest in order to improve the score. But anyway this is like a game as every time I submit the result,  I can obtain the score. It is very exciting when the score is getting improved!

K4


This list of competitions below is for the beginners. Everyone can challenge the problems below after you sign off.  I like “Titanic”. In this challenge we should predict who could survive in the disaster.  Can we know who is likely to survive based on data, such as where customers stayed in the ship?  This is also “classification”problem. Because the “target” is “survive”or “not survive”.

K2


You may not be interested in data-scientists itself. But it is worth challenging these competitions for everyone because most of business managers have opportunities to discuss data analysis with data-scientists in the digital economy. If you know how data is analyzed in advance, you can communicate with data-scientists smoothly and effectively. It enables us to obtain what we want from data in order to make better business decisions.  With this challenge I could learn a lot. Now it’s your turn!

This course is the best for beginners of data analysis. It is free, too!

shield-229112_1280

Last week, I started learning on-line course about data analysis. It is “The Analytics Edges” in edx, one of the biggest platforms of MOOCs all over the world (www.edx.org).  This course says “Through inspiring examples and stories, discover the power of data and use analytics to provide an edge to your career and your life.”   Now I completed Unit one and two out of  total nine in the course and found that it is the best course for beginners of data analysis in MOOCs. Let me tell you why it is.


1. There are a variety of data sets to analyze

When you start learning data analysis, data is very important to motivate yourself to continue to learn.  When you are sales personnel, sales data is the best to learn data analysis because you are interested in sales as professional.  When you are in financial industries, financial data is the best for you.   This course uses a variety of data from crime rate to automobile sales.  Therefore, you can see the data you are interested in. It is critically important for beginners of data analysis.


2. This course focuses on how to use analytics tools, quite than the theory behind the analysis

Many of data analysis courses take a long time to explain the theory behind the analysis.  It is required when you want to be a data scientist because theory is needed to construct an analytic method by yourself. However, most of business managers do not want to be data scientists.  All business managers need is the way to analyze data to make better business decisions. For this purpose, this course is good and well-balanced between theory and practice.  Firstly, a short summary of theory is provided, then move on to practice. Most of  the lectures focus on “how to use R for data analysis”. R is one of the famous programming languages for data analysis, which is free for everyone.  It enables beginners to use R in analyzing data step by step.


3. It covers major analytic methods of data analysis.

When you see the schedule of the course,  you find many analytic methods from linear regression to optimizations.  This course covers major methods that beginners must know.  I recommend to focus on linear regression and logistic regression when you do not have enough time to compete all units because both of method is applicable to many cases in the real world.


I think it is worth seeing only the video in Unit 1 and 2.  Interesting topics are used especially for people who like baseball. If you do not have enough time to learn R programming, it is OK to skip it. The story behind the analysis is very good and informative for beginners. So you may enjoy the videos about the story and skip videos of programming for the first time. If you try to obtain a certificate from edx, you should obtain 55% at least over the homework, competition and final exam.  For beginners, it may be difficult to complete the a whole course within limited time (three-month).  Do not worry.  I think this course can be learned again in time to come.  So first time,  please focus on Unit1 and Unit2, then a second time, try a whole course if  you can. In addition, most of edx courses including this are free for anyone.   You can enjoy anytime, anywhere as long as you have an internet access.  Could you try this course with me (www.toshistats.net) ?

What is the best language for data analysis in 2015 ?

word-cloud-432032_1280


RedMonk issued the raking about popularity of programming languages. This research is conducted periodically since 2010. This chart below is coming from this research. Although general purpose languages such as JavaScript occupy top 10 ranking,  statistical language is getting popular.  R is ranked 13th and MATLAB is ranked 16th. I have used MATLAB since 2001 and R since 2013 and currently study JavaScript. Then I found that the deference between R, which is statistical language, and other general purpose languages. Let us consider it in details and good way to learn statistical languages such as R and MATLAB.


languages 2015


1.  R focuses on data

Because R is a statistical language,  it focuses on data to be analyzed.  These data are handled in R as vectors and matrices. Unlike JavaScript, there is no need to define variables to handle data in R. There is no need to distinguish between scalar and vector, either.  So it is easy to start analyzing data with R, especially for beginners. Therefore I think the best way to learn R is to be familiar with vectors and matrices because data is represented as vectors or matrices in R.


2.  R has a lot of functions to analyze data

R has a lot of functions because many professionals contribute to develop statistical models with R. Currently there are more than 7000 functions, which are called “R package”. This is one of the biggest advantages to learn R for data analysis. If you are interested in “liner regression model” , which is the most simple model to predict price of services and goods,  all you have to do is just writing command “lm” then R can output the parameters so that predictions of prices can be obtained.


3. R is easy to visualize data

If you would like to draw the graph,  all you have to do is to write the code ‘plot’ then simple graph appears on the screen.  When there are a lot of series of data and you would like to know relationship among each of them and other,  all you have to do is to write the code ‘pairs’ then a lot of scatter charts appear so that we can understand the relationship among each of them.  Please look at the example of charts by “pairs”.

Rplot01


R is open source and free to anyone. However MATLAB is proprietary software.  It means that you should buy licenses of MATLAB if you would like to use it. But do not worry about that. Octave, which is similar to MATLAB, is available without license fee as an open source software.  I recommend you to use R or Octave for beginners of data analysis because there is no need to pay any fee.

Going forward, R must be more popular in programming languages. It is available for everyone without any cost.  R is introduced as a major language for data analysis in my company and I would recommend all of you to learn R as I do.  Is it fun, isn’t it?

Last week I held a seminar in Tokyo. Everyone is active in learning data analysis.

meeting-469574_1280

Last week I had a business trip to Tokyo and held a seminar about data analysis for businessmen/women.  There were around ten participants in this seminar and  everyone is a young business men/women, not a data scientist.  Title is “How to predict price of wine”. Based on the data about temperatures and amount of rain, price of wine may be predicted by using liner regression model. This analysis was explained in my blog before.


This seminar was about one and half hour. During the seminar I felt that every participant is interested in data analysis very much.  I had a lot of questions about data analysis from them.  I think they face problems with a lot of data on a daily basis. Unfortunately it is not easy to analyse data so that better business decisions can be made according to the results of analysis. I hope I can provide clues to solve the problems for participants.


In my seminar, I focused on liner regression model. There are three reasons why I choose this model.

1.  It is the simplest model in data analysis.

It uses inner product of parameters and explanatory variables. This is very simple and easy to understand, however,  it appears many times in statistical models and machine learning. Once participants can be familiar with inner product, they can apply it to  more complex models.


2.  Liner regression model can be basis in learning more complex models.

Although liner regression model is simple, it can be extended to more complex models. For example, logistic regression model uses same inner product as liner regression model. Structures of these two models are similar each other. Neural network can be expressed as layers of logistic regression model.  Support vector machine uses inner product of parameters and explanatory variables, too.


3.  Method to obtain parameters can be expanded to more complex models.

Obtaining parameters is a key point to use statistical models effectively.  In order to do that, least squares method is used in liner regression model.  This method can be expanded to Maximum likelihood estimation, which is used in logistic regression model.


If you are a beginner of data analysis,  I would like to recommend to learn liner regression model as the first step of data analysis. Once you can understand liner regression model, it enable you to understand more complex models. Anyway, let us start learning liner regression model. Good luck!

How can we predict the price of wine by data analysis ?

restaurant-386820

Before discussing the models in details,  It is good to explain how models work in general, so that beginners for data analysis can understand models. I select one of the famous research of wine quality and price by  Orley Ashenfelter , a professor of economics at Princeton university. You can look at the details of the analysis on this site. This is “BORDEAUX WINE VINTAGE QUALITY AND THE WEATHER”. I calculated them by myself in order to explain how models work in data analysis.


1. Gathering data

Quality and price of wine are closely related to the quality of the grapes.  So it is worth considering what factors impact the quality of the grapes.  For example, Temperatures, quantities of rain, the skill of the farmers, the quality of vineyards may be candidates of the factors. Historical data of each factor for more than 40 years are needed in this analysis. It is sometimes very important in practice, whether data is available for longer periods. Here is the data used in this analysis.  So you can do it by yourself  if you want to.


2.  Put data into models

Once data is prepared, I input the data into my model in R. This time, I use linear regression model, which is  one of the simplest models.  This model can be expressed by the products of explanatory variables and parameters. According to the web sites,  explanatory variable as follows

       WRAIN      1  Winter (Oct.-March) Rain  ML                
       DEGREES    1  Average Temperature (Deg Cent.) April-Sept.   
       HRAIN      1  Harvest (August and Sept.) ML               
       TIME_SV    1  Time since Vintage (Years)

This is RStudio, famous Integrated Development Environment for R.   Upper left side of RStudio, I developed the function with linear regression “lm” with R and data from the web site is input into the model.

スクリーンショット 2014-09-30 14.05.37


3. Examine the outputs from models

In order to predict wine price,  parameters should be obtained firstly.  There is no need to worry about.  R can calculate this automatically. The result is as follows. Coefficients mean parameters here. You can see this result in lower left side of RStudio.

Coefficients:

(Intercept)     WRAIN    DEGREES   HRAIN    TIME_SV
-12.145007   0.001167   0.616365   -0.003861   0.023850

Finally, we can predict wine price. You can see the predictions of wine price in lower right side of RStuido.

Rplot

This graph shows the comparison between the predictions of wine price and real price of wine.  Red square tells us predictions of price and Blue circle tells real price. These are relative prices against an average price in 1961.  So the real price in 1961 is 1.0.  It seems that the model works well.  Of course it may not work now as it was made more than 20 years ago. But it is good to learn how models work and predictions are made by this research. Once you can understand the linear regression model, it enables you to understand other complex models with ease. I hope you can enjoy prediction of wine price. OK, let us move on recommender engines again next week !


Notice: TOSHI STATS SDN. BHD. and I do not accept any responsibility or liability for loss or damage occasioned to any person or property through using materials, instructions, methods, algorithm or ideas contained herein, or acting or refraining from acting as a result of such use. TOSHI STATS SDN. BHD. and I expressly disclaim all implied warranties, including merchantability or fitness for any particular purpose. There will be no duty on TOSHI STATS SDN. BHD. and me to correct any errors or defects in the codes and the software.

Why is “Recommendation” critically important for small and medium enterprises ?

dress-shop-97261_1280

When I teach data analysis,  I always consider what the best application of statical models to the real businesses is.  I researched it several weeks and I found a recommender engine is one of the best applications to explain how statistical models or machine learning work in the real world.  Now that most people get the recommendations about products, services, news through emails and websites.  One of the famous examples is the recommendation by Amazon.com.  So it is easy to understand what recommendations are and how useful they are.

I provided recommendations to my customers manually when I used to be an account executive at the branch of the security company more than 20 years ago.  I had more than 200 customers there and sold the financial products to them. It was an interesting  job as financial markets have been moving every day, every second. But there were problems about the way of marketing at that time.


1.  I could not take care of every customer effectively

I could contact 20 or 30 customers by phone on a daily basis (there were no e-mails at that time). It was impossible, however, to contact more than 200 customers so I might miss or overlook the needs of customers because I could not understand who the customers were and what they wanted within limited time. It led to opportunity cost for me.


2 . I could not understand all products effectively

When I used to be an account executive,  financial innovation was going on in Japan.  It means that not only traditional products, such as stocks and bonds, but also derivatives and options were available to retail investors.  There was not enough time for me to understand every product in detail.  So I might fail to satisfy customers’ needs due to lack of knowledge of products which were available at that time.


If I could have a recommender at that time, these problems above could be solved as recommender engine could make the most of the information about both customers and products at once, in a timely manner. In order to provide good recommendations, it is clear that information about both customers and products are needed. It might be time-consuming and require human resources  if we manage this information manually. But recommender engine can process it quick enough to provide recommendations in a timely manner. When companies, such as SME have small sales force, recommender engines are critically important because it enables such companies to provide recommendations to customers effectively.  This is one of the best ways to communicate to customers with reasonable cost as well.


So I want to develop a recommender engine to provide good recommendations based on information from customers and products.  My company is starting an open project to develop a recommender engine with R.  This will be open source and get public so that everyone can learn how it works if he/she is interested in it.  I will report the progress of the project on this blog going forward. I hope you can enjoy it!