This is my first “Deep learning” with “R+H2O”. It is beyond my expectation!

dessert-352475_1280

Last Sunday,  I tried “deep learning” in H2O because I need this method of analysis in many cases. H2O can be called from R so it is easy to integrate H2O into R. The result is completely beyond my expectation. Let me see in detail now!

1. Data

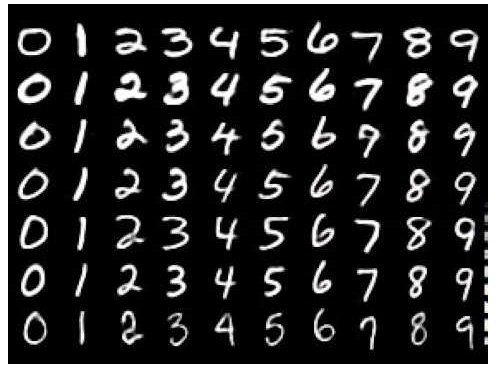
Data used in the analysis is ” The MNIST database of handwritten digits”. It is well known by data-scientists because it is frequently used to validate statistical model performance.  Handwritten digits look like that (1).

MNIST

Each row of the data contains the 28^2 =784 raw grayscale pixel values from 0 to 255 of the digitized digits (0 to 9). The original data set of The MNIST is as follows.

  • Training set of 60,000 examples,
  • Test set of 10,000 examples.
  • Number of features is 784 (28*28 pixel)

The data in this analysis can be obtained from the website (Training set of 19,000 examples, Test set of 10,000 examples).


2. Developing models

Statistical models learn by using training set and predict what each digit is by using test set.  The error rate is obtained  as “number of wrong predictions /10,000″. The world record is ” 0.83%”  for models without convolutional layers, data augmentation (distortions) or unsupervised pre-training (2). It means that the model has only 83 error predictions in 10,000 samples.

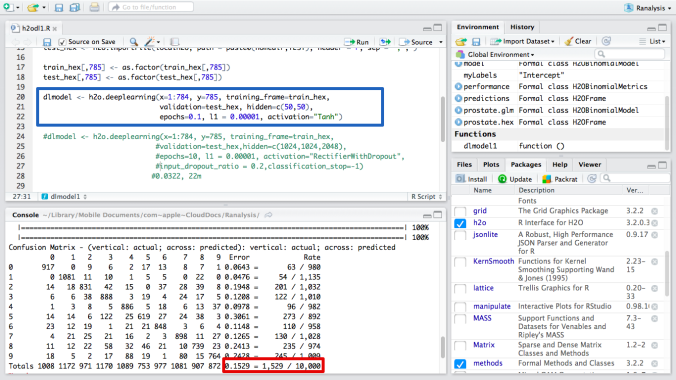
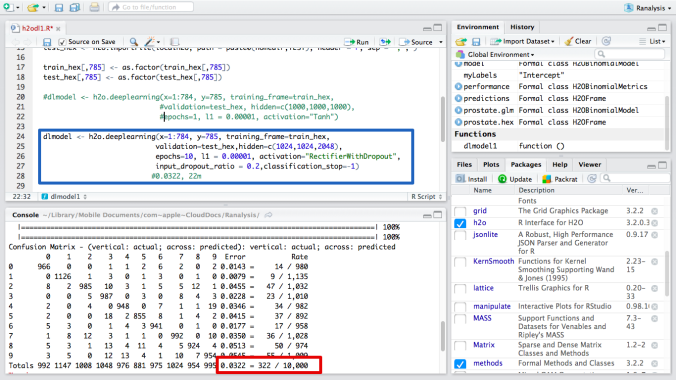
This is an image of RStudio, IDE of R.  I called H2O from R and write code “h2o.deeplearning( )”.  The detail is shown in the blue box below.  I developed the model with 2 layers and 50 size for each. The error rate is 15.29% (in the red box).  I need more improvement of the model.

DL 15.2

Then I increase the number of layers and sizes.  This time,   I developed the model with 3 layers and 1024, 1024, 2048 size for each. The error rate is 3.22%, much better than before (in the red box).  It took about 23 minutes to be completed. So there is no need to use more high-power machines or clusters so far ( I use only my MAC Air 11 in this analysis). I think I can improve the model more if I tune parameters carefully.

DL 3.2

Usually,  Deep learning programming is a little complicated. But H2O enable us to use deep learning without programming when graphic user interface “H2O FLOW” is used.  When you would like to use R,   the command of deep learning to call H2O  is similar to the commands for linear model (lm) or generalized linear model (glm) in R. Therefore, it is easy to use H2O with R.


This is my first deep learning with R+H2O. I found that it could be used for a variety cases of data analysis. When I cannot be satisfied with traditional methods, such as logistic regression, I can use deep learning without difficulties. Although it needs  a little parameter tuning such as number of layers and sizes,  it might bring better results as I said in my experiment. I would like to try “R+H2O” in Kaggle competitions, where many experts compete for the best result of predictive analytics.


P.S.

The strongest competitor to H2O appears on 9 Nov 2015.  This is ” TensorFlow” from Google.  Next week,  I will report this open source software.


Source

1. The image from GitHub  cazala/mnist

https://github.com/cazala/mnist

2. The Definitive Performance Tuning Guide for H2O Deep Learning , Arno Candel, February 26, 2015

http://h2o.ai/blog/2015/02/deep-learning-performance/


Note: Toshifumi Kuga’s opinions and analyses are personal views and are intended to be for informational purposes and general interest only and should not be construed as individual investment advice or solicitation to buy, sell or hold any security or to adopt any investment strategy.  The information in this article is rendered as at publication date and may change without notice and it is not intended as a complete analysis of every material fact regarding any country, region market or investment.

Data from third-party sources may have been used in the preparation of this material and I, Author of the article has not independently verified, validated such data. I and TOSHI STATS.SDN.BHD. accept no liability whatsoever for any loss arising from the use of this information and relies upon the comments, opinions and analyses in the material is at the sole discretion of the user. 

Who will be the winner in the competition of convenience stores in Japan?

030cc0d63c6ae43226f003c8b0bb4527_s

Today I am in Tokyo, Japan. So I would like to write convenience stores in Japan.  Since 7-eleven opened in 1974, there are a lot of varieties of  convenience stores in Japan. But as the populations of Japan are decreasing  and too many convenience stores are already in Japan,  Competions of convenience stores are getting tougher and tougher. Therefore, small and medium sized store chains have a hard time and some of them are acquired d by big  convenience store chains.  Now it is almost clear that the big three, which are 7-elevenLawson and Family Mart, dominate the market.

There are many convenience stores in Japan.  Therefore, they have huge impacts to merchandise there. For example,  a cup of coffee is served at the counter of most of convenience stores. Some of them are self-serviced. The taste is very good, although it is reasonable (around 100JPY).  They are getting popular and compete with canned  coffee in vendor machines or coffee shops.  You can try this coffee when you come to Japan as there are many convenience stores near the stations.


In terms of usage of big data for business decisions,  I am very interested in Lawson because it analyses data from stores and predict what products are popular.  This picture is my “Ponta CARD”.  When I buy products at Lawson, I present it at the counter.  So Lawson knows what and when I buy there.  It works all over Japan, therefore a huge amount of data is collected and analyzed everyday.

IMG_20151021_111426

According to “Top Management Message October 7, 2015” by Lawson,  it introduces more advanced “semi-automatic ordering system”. Let see what it is.

“We began introducing our new semi-automatic ordering system from June to improve the delivery of products to our stores. The system is designed to recommend the most appropriate product lineup and number of items for delivery based on a range of data for ready-made snack meals and other categories, such as Ponta member purchasing trends, a store’s most recent sales data and information on heavy user purchases, information from other stores with a similar customer base, the weather, and finally information on the various campaigns conducted. The semi-automatic ordering system had been introduced in approximately 7,500 stores at the end of August 2015.” (1)

It is amazing!  Convenience store is usually not so big. Therefore, it is very important to know how many and what products are on store shelves. Data tells us how to do that accurately! I would like to research  what important factors are in this analysis going forward. You may be interested in them, too!


When you come to Japan,  you can find convenience stores at the every corner of the cities. There are many onigiri (rice ball), bento (lunch box), breads, beverages and sweets. Most of them are open 24 hours a day so you can enjoy shopping  anytime you want. Let us go there and see who will be the winner in the competition of convenience stores in Japan!


Source

1. Lawson website

http://lawson.jp/en/ir/message/backnumber/151007.html


Note: Toshifumi Kuga’s opinions and analyses are personal views and are intended to be for informational purposes and general interest only and should not be construed as individual investment advice or solicitation to buy, sell or hold any security or to adopt any investment strategy.  The information in this article is rendered as at publication date and may change without notice and it is not intended as a complete analysis of every material fact regarding any country, region market or investment.

Data from third-party sources may have been used in the preparation of this material and I, Author of the article has not independently verified, validated such data. I and TOSHI STATS.SDN.BHD. accept no liability whatsoever for any loss arising from the use of this information and relies upon the comments, opinions and analyses in the material is at the sole discretion of the user. 
What will be the flight service in the future? I write it in the air!

wing-221526_640

Now I am in the air from Kuala Lumpur to Tokyo as I have a business trip.  I always use Air Asia because it is convenient and reasonable. Since AirAsia has operated,  it is getting cheaper to flight from Kuala Lumpur to Tokyo. It is very good, especially for younger generations. I would like to welcome them in Japan very much.  Then I am wondering what the flight service will be in the future. Let us consider it with me!


1. Service on flight

Low cost carriers, including AirAisa increase the number of customers per flight compared with legacy carriers to reduce the price of the flight. Therefore services for each customer are not the sane as legacy carriers.  I think, however, it will be improved dramatically supported by digital technologies.  At each site, electronic dashboard might be equipped and all information, such as flight schedules,  emergency evacuation methods might be provided.  These are translated into many languages with machine translations so there is no need to worry about language barriers. ( In my flight of AirAsia, English, Japanese and Malay are used in the flight announcement. ) Meals in a fight will be improved, too.  We might order meals on demand through the electronic dashboard whenever you want to eat. These data can be collected customer by customer.  Therefore, preference of each customer might be known in advance.  This technology is called “personalization”. So low cost carriers might predict what kind of meals are needed in the flight based on past experience of  each customer. It enables them to widen the variety of meals served because there is less risk to have a lack of inventories of meals on the flight.  To serve meals to each customer,  robots of cabin attendant assistants might support cabin attendants so that meals are served smoothly. I am excited if I can choose many varieties of meals on demand.


2. Immigration

Before getting on the board,  it takes time to pass immigration.  I always think it might be more effective with technologies called “face recognition”.  Computers can identify who you are by comparing to your face image stored on the passport. It is good to take less time to pass immigration for everyone. If it is connected to a database of INTERPOL,  it can enhance identification of criminals.


3.  Maintenance

Airplanes have a massive amount of parts. Therefore, maintenance is critically important to keep flights safe. Especially for low cost carriers, there is less time to maintain airplanes from landing to taking off again.  It can be enhanced by technologies   called “internet of things” and “predictive analytics“.  In internet of things,  each part has sensors and provide data periodically thought the internet.  Data from the sensors are collected and analyzed by “predictive analytics” to predict which parts are likely to fail in  advance.  Maintenance can be  more effective by using the results of  predictive analytics. Data from sensors can be transmitted from airlines to airports, even though they are in the air. Therefore failed parts or potential one can be identified before air plains land.  It enables us to decrease the time of maintenance.


Beyond low cost carriers,  the airplane in the air might be connected to other industries such as hotels. For example, the flight might be delayed due to bad weather and customers need reservations of hotels as the flight will land at the midnight. In such case, We can reserve hotels thought digital dashboard of each sheet. It is good to have reservations of the hotel even if we are in the air!

I hope my flights will be more comfortable in the future!  Could you agree?


Note: Toshifumi Kuga’s opinions and analyses are personal views and are intended to be for informational purposes and general interest only and should not be construed as individual investment advice or solicitation to buy, sell or hold any security or to adopt any investment strategy.  The information in this article is rendered as at publication date and may change without notice and it is not intended as a complete analysis of every material fact regarding any country, region market or investment.

Data from third-party sources may have been used in the preparation of this material and I, Author of the article has not independently verified, validated such data. I and TOSHI STATS.SDN.BHD. accept no liability whatsoever for any loss arising from the use of this information and relies upon the comments, opinions and analyses in the material is at the sole discretion of the user. 
Linkedin bought a predictive marketing company. What does it mean?

conference-room-768441_640

I think many people like Linkedin as a platform of professionals and they are interested in what is going on in the company.  Last week, I found that “Today we are pleased to announce that we’ve acquired Fliptop, a leading provider of predictive sales and marketing software.1″  (David Thacker said on the blog on 27 August, 2015 ).  Linekdin bought a leading predictive marketing company.  What does it mean? Let me consider a little.


1. What does “Fliptop” do?

It is a marketing software company. On the website, it says  “DRIVE REVENUE FASTER WITH PREDICTIVE MARKETING”, “Increase lead conversion rates and velocity.” and “Identify the companies most likely to buy”.  It was established in 2009 so it is a relatively young company. The company uses technologies called “Machine learning” to identify potential customers with high probability of purchase of products and services.   According to the website of the company, it has an expertise of standard machine learning algorithms, such as logistic regression and decision trees. These methods are used for classifications or predictions.  For example,  the company can identify who is likely to buy the products based on data, including the purchase history of each customer in the past. It hires computer science experts to develop the models for predictions.


2. What will Linkedin do with Fliptop?

As you know, Linkedin has a huge customer base so it has a massive amount of data generated by users of Lnkedin everyday.  This data have been accumulated every second. Therefore Lnikedin should have an ability and enhance it to make the most out of the data.  Linkedin should analyze the data and make better business decisions to compete other IT companies in the markets. In order to do that, there are two options, 1. Technologies developed In-house,  2. Purchase of resources outside the company.  Lnkedin took an option of “2” this time. Doug Camplejohn, CEO of Fliptop, said “We will continue to support our customers with existing contracts for some period of time, but have decided not to take on any new ones. We will also be reaching out to our customers shortly to discuss winding down their existing relationship with Fliptop.”.  Therefore Fliptop will not be independent as a service provider and will be integrated into the functions of Linkedin. It seems that knowledge and expertise of Fliptop are seamlessly integrated into Linkedin in future.  I am not so sure what current users of Fliptop should do as long as I know now.


3.  Data is “King”

This kind of purchases has been seen in IT industry recently. Google bought “DNN research” in 2013 and “DeepMind” in 2014. Microsoft also bought “Revolution Analytics” in 2015.  These small or medium size companies have expertise in machine learning and data analysis.  When they try to expand their businesses, they need massive data to be analyzed. However, they are not owners of a massive amount of data. Owners of a massive amount of data are usually big IT companies, such as Google and Facebook.  It is sometimes difficult for relatively small companies to obtain a massive amount of data, including  customer data.  On the other hand, big IT companies, including Linkedin, are usually owners of huge customer data. In addition to that, big IT companies now  enhance resources and expertise to analyze data as well. Once they have both of them, new services can be created and offered in a shorter period. The more people use these services, the more accurate and effective they can be.  Therefore, it sounds logical when big IT companies acquire small companies with expertise in data analysis and machine learning. Big IT companies definitely need their expertise in data analysis and machine learning.


From the standpoint of consumers, it is good because they can enjoy many services offered by big IT companies with lower costs. But from the standpoint of companies, competitions are getting tougher as this occurs not only in IT industries but many other industries. Now Linkedin seems to be ready for this competition, which comes in the future.

Machine learning is sometimes considered as engines and data are considered as fuel.  When they are combined in one place, new knowledge and insights may be found and new products and services may be created.  It accelerates changes of the landscape of the industries. Mobile, cloud, big data, IOT and artificial intelligence will contribute to this change a lot. It must be exciting to see what happens next in the future.


Source

1. Accelerating Our Sales Solutions Efforts Through Fliptop Acquisition, David Thacker, August 27, 2015 

http://sales.linkedin.com/blog/accelerating-our-sales-solutions-efforts-through-fliptop-acquisition/

2.A New Chapter,  Doug Camplejohn, August 27, 2015

http://blog.fliptop.com/blog/2015/08/27/a-new-chapter/


Note: Toshifumi Kuga’s opinions and analyses are personal views and are intended to be for informational purposes and general interest only and should not be construed as individual investment advice or solicitation to buy, sell or hold any security or to adopt any investment strategy.  The information in this article is rendered as at publication date and may change without notice and it is not intended as a complete analysis of every material fact regarding any country, region market or investment.

Data from third-party sources may have been used in the preparation of this material and I, Author of the article has not independently verified, validated such data. I accept no liability whatsoever for any loss arising from the use of this information and relies upon the comments, opinions and analyses in the material is at the sole discretion of the user. 
How can we create good movies based on big data?

home-theater-873241_1280

Last Sunday, my son came to Kuala Lumpur as he has summer vacation now.  So  I brought him to the movie theater.  I chose “Mission: Impossible – Rogue Nation” to entertain him.  In the movie, Tom cruise is very active.  I cannot believe he is older than I am!  My son and I could enjoy the movie very much, as his action is amazing.

Then I am wondering how we can create good movies.  Every year, many movies are created, but few of them can stay in people’s mind in the long term.  Let me consider it here for a while.

1. How can we define what good movies are?

There are many measures to evaluate movies.  Critics can assess the quality of movies. But I would like to make it simple.  Number of customers who watch the movie or the amount of sales revenue such as “Box office“of the movie can be used as a measure of “good movie” as it is easy to collect and measure. So the more people watch the movie, the better it is according to our definition of “good movies”.


2. Let us consider something related to the number of customers or sales revenue.

A lot of things relate to them.  Like Mission:Impossible,  actors and actresses are very important.  The director is also important.  In addition to that,  where is it created?  Is it an action movie or a love story or a thriller?,  and so on. They may be closely related to the number of customers or sales revenue of the movie.  So the data about something related to the number of customers or sales revenue in the past should be collected.


3. How can we obtain predictions of the number of customers or sales revenue of the  unseen movie in advance?

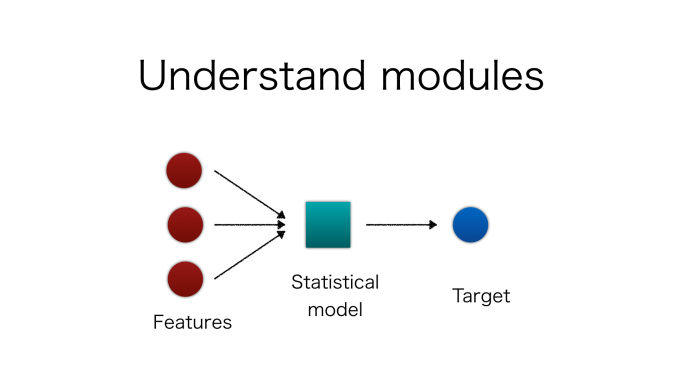
Could you remember the last week’s letter about “Target” and “Features”?  “Target” is something that we want to predict and “Features” are something that are related to “Target”.  Predictions of “Target” can be obtained by inputting “features” into “Statistical model”.  I would like to call this unit “module”.   I summarize it as follows.

modules

According to our definition of “good movies”,  Target is the number of customers or sales revenue of the movie. Features are actors and actress, category of the story, locations where the movie was taken, and so on. So these features are input to statistical models to obtain predictions of target for unseen movies.  Based on this analysis,  we could predict the sales of movies before they are seen in theaters. It means that good movies could be created based on this prediction. When this prediction is accurate,  film production companies might increase sales revenue  because they can create good movies based on predictions of Targets. But in reality, we should prepare a lot of data to predict them accurately.  In additions to that,  customer preference might be changed suddenly, however, it is very difficult to update the statistical models in advance to follow such changes. Therefore, there is a risk where statistical models can not follow circumstance changes in a timely manner.


It should be noted that more features will be available as computers will understand videos or movies. Now the technology 1is in progress.  It will enable computers to turn videos into texts. For example, when there is a scene where the swan is on the lake, computers understand the video and make sentences that explain the scene automatically.  It means that whole part of the movie can be transformed into texts without human intervention. So movies will be analyzed based on their stories. More features can be identified in the results of this analysis. When new kinds of data are available to us, it may enable us to obtain more features and improve accuracy of predictions.  Would you likely to make your own movie in future?


Source

1. A picture is worth a thousand (coherent) words:building a natural description of images, 17 Nov 2014,  Google Research

http://googleresearch.blogspot.co.uk/2014/11/a-picture-is-worth-thousand-coherent.html


Note: Toshifumi Kuga’s opinions and analyses are personal views and are intended to be for informational purposes and general interest only and should not be construed as individual investment advice or solicitation to buy, sell or hold any security or to adopt any investment strategy.  The information in this article is rendered as at publication date and may change without notice and it is not intended as a complete analysis of every material fact regarding any country, region market or investment.

Data from third-party sources may have been used in the preparation of this material and I, Author of the article has not independently verified, validated such data. I accept no liability whatsoever for any loss arising from the use of this information and relies upon the comments, opinions and analyses in the material is at the sole discretion of the user. 

“Prediction” is very important in analyzing big data of the business

money-548948_640

It is a good timing to reconsider “Big data and digital economy” because this name of group on Linledin has four-month-history and more than 100 participants now. I would like to appreciate the cooperation of all of you.

In the beginning of 2000s, I worked in the risk management dept in the Japanese consumer finance company.   There is a credit risk model which can predict who is likely to be in a default in the company. I learned it more details and understood how it worked so accurately. I found that if I collect a lot of data about customers, I could obtain accurate predictions for events of defaults in terms of each customer.

Now in 2015,  I researched many algorithms and statistical models including the state of art “deep learning”.   While there are many usages and objectives in using such models,  in my view,  the most important thing for business persons is “prediction” just like my experience in consumer finance company because they should make good business decisions to compete in markets.

If you are in health care industry,  you may be interested in predictions about who is likely to be cured. If you are in sales, you may be interested in predictions about who is likely to come to the shop and buy the products. If you are in marketing,  you may be interested in who is likely to click the advertisement on the web.  Whatever you do,  predictions are very important for your businesses because it enables us to take the right actions.  Let me explain key points about predictions.


Target

What are your interests to predict?    Revenue of your business?  Number of customers?    Satisfaction rate based on client feedback?  Price of wine near futures? You can mention anything you want.  We call it “Target”.  So firstly, “Target” should be defined in predictions so that you can make right business decisions.


Features

Secondly,  let us find something related to your target.  For example,   If you are a sales person and interested in who is likely to buy the products,  features are “attributes of each customer such as age, sex, occupation” , “behavior of each customer such as how many times he/she come to the shop per month and when he/she bought the products last time”,  “What did he/she click in the web shop”  and so on.  Based on the prediction, you can send coupons or tickets to “highly likely to buy”customers in order to increase your sales.  If you are interested in the price of wine,  features may be temperature,  amount of rain and locations of farms,  and so on.  If you can predict the price of wine,  you might make  good investments of wine.  These are just simple examples. In reality,  a number of features may be 100,  1000  or more.  It depends on whole data you have.  Usually the more data you have, the more accurate your predictions are.  This is why data is very important to obtain predictions.


Evaluation of predictions

Finally by inputting features into statistical models,  predictions of the target can be obtained. Therefore, you can predict who is likely to buy the products when you think of marketing strategies.  This is good for your business as marketing strategies can be more effective.  Unfortunately customer preferences may be changed in the long run.  When situations and environments such as customer preferences are changed,  predictions may not be accurate anymore.  So it is important to evaluate predictions and update statistical models periodically.  No model can work accurately forever.


Once you can obtain the prediction,  you can implement processes of the predictions as a daily activity, rather than one-off analysis. It means that data driven decisions are made on a daily basis.  It is one of the biggest aspects of “digital economy”.  From retail shops to health care and financial industry,  predictions are already used in many fields.  The methods of predictions are sometimes considered as “black-box”.  But I do not think It is good to use predictions without understanding the methods behind predictions. I would like to explain them in my weekly letter in future.  Hope you enjoy it!


Note: Toshifumi Kuga’s opinions and analyses are personal views and are intended to be for informational purposes and general interest only and should not be construed as individual investment advice or solicitation to buy, sell or hold any security or to adopt any investment strategy.  The information in this article is rendered as at publication date and may change without notice and it is not intended as a complete analysis of every material fact regarding any country, region market or investment.

Data from third-party sources may have been used in the preparation of this material and I, Author of the article has not independently verified, validated such data. I accept no liability whatsoever for any loss arising from the use of this information and relies upon the comments, opinions and analyses in the material is at the sole discretion of the user. 

The reason why computers may replace experts in many fields. View from “feature” generation.

public-domain-images-free-stock-photos-aureliejouan-lights

Hi friends, I am Toshi. I updated my weekly letter.  Today I explain 1. How classification, do or do not, can be obtained with probabilities and 2. Why computers may replace experts in many fields from legal service to retail marketing.   These two things are closely related to each other. Let us start now.


1.  How can classification be obtained with probabilities?

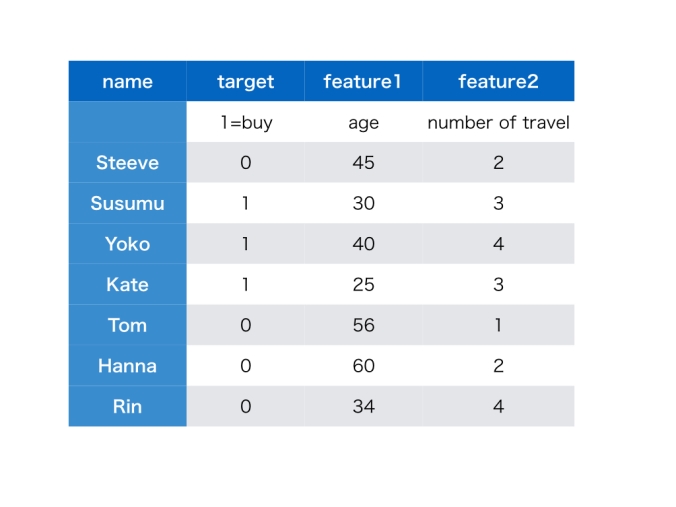
Last week, I explained that “target” is very important and “target” is expressed by “features”.  For example Customer “buy” or “not buy” may be expressed by customers age and  the number of  overseas trips a year.  So I can write this way : “target” ← “features”.   This week, I try to show you the value of “target” can be a probability, which is  a number between 0 and 1.  If the “target” is closer to “1”,  the customer is highly likely to buy.   If the target is closer to “0”,  the customer is less likely to buy.   Here is our example of “target” and “features” in the table below.

customer data

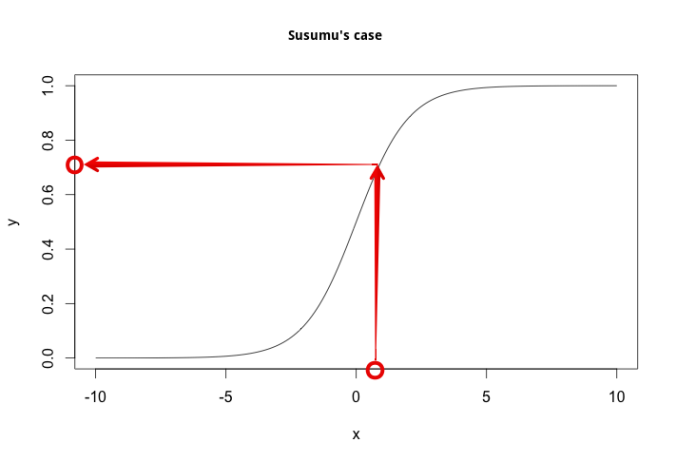
I want  Susumu’s value of the “target” to be close to “1” in calculations by using “features”.  How can we do that?   Last week we added “features” with“weight” of each feature.   For example  (-0.2)*30+0.3 *3+6,  the answer is 0.9.  “-0.2″ and “0.3” are the weight for each feature respectively. “6” is a kind of adjustment.  Next let us introduce this curve below. In the case of Susumu, his value from his features is 0.9. So let us put 0.9 on the x-axis, then what is the value of y? According to this  curve, the value of y is around 0.7. It means that  Susumu’s probability of buying products is around 0.7.  If probability is over 0.5, it is generally considered that customer is likely to buy.

logistic1

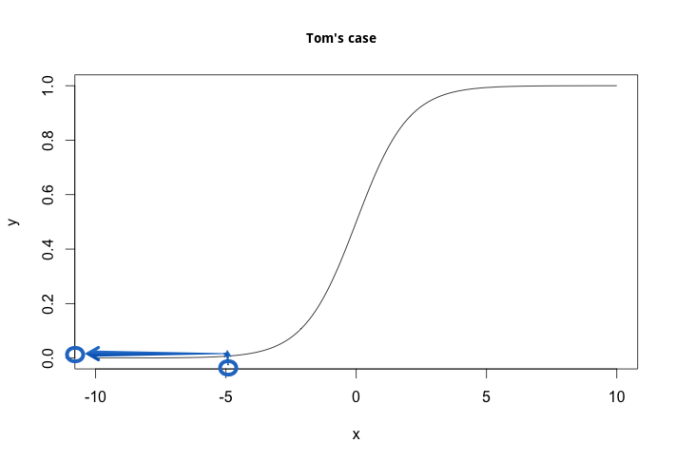
In the case of Tom, I want his value of the “target” to be close to “0” in calculations by using “features”.  Let us add his value of features as follows  (-0.2) *56+0. 3 *1+6,  the answer is -4.9.  His value from his features is -4.9. So let us put  -4.9 on the x-axis, then what is the value of y?  According to this curve, Tom’s probability of buying products is almost 0. Unlike Susumu’s case, Tom is less likely to buy.

logistic2

This curve is called “logistic curve“.   It is interesting that whatever value “x” takes, “y” is always between 0 and 1.  By using this curve, everyone can have the value between 0 and 1, which is considered as the probability of the event. This curve is so simple and useful that it is used in many fields.  In short, everyone has a probability of buying products, which is expressed as the value of “y”.  It means that we can predict who is likely to buy in advance as long as “features”are obtained! The higher value customers have, the more likely they will buy the products.


2.  Why may computers replace experts in many fields?

Now you understand what are”features”.  “Features” generally are set up based on expert opinion. For example, if you want to know who is in default in the future, “features”needed are considered “annual income”, “age”, “job”, “the past delinquency” and so on. I know them because I used to be a credit risk manager in consumer finance company in Japan.  Each expert can introduce the features in the business and industries.  That is why the expert’s opinion is valuable, so far. However, computers are also creating their features based on data. They are sometimes so complex that no one can understand them. For example, ” -age*3-number of jobs in the past” has no meaning for us. No one knows what it means. But computers do. Sometimes computers can predict “target”, which means “do” or “not do” with their own features more precisely than we do.


In the future,  I am sure much more data will be available to us.  It means computers have more chance to create better “features” than experts do. So experts should use the results of predictions by computers and introduce them into their insight and decisions in each field.  Otherwise, we cannot compete with computers because computers can work 24 hours/day and 365 days/year. It is very important that the results of predictions should be used effectively to enhance our own expertise in future.


Notice: TOSHI STATS SDN. BHD. and I, author of the blog,  do not accept any responsibility or liability for loss or damage occasioned to any person or property through using materials, instructions, methods, algorithm or ideas contained herein, or acting or refraining from acting as a result of such use. TOSHI STATS SDN. BHD. and I expressly disclaim all implied warranties, including merchantability or fitness for any particular purpose. There will be no duty on TOSHI STATS SDN. BHD. and me to correct any errors or defects in the codes and the software.

“Classification” is significantly useful for our business, isn’t it?

public-domain-images-free-stock-photos-high-quality-resolution-downloads-public-domain-archive-14

Hello, I am Toshi. Hope you are  doing well. Now I consider how we can apply data analysis to our daily businesses.  So I would like to introduce “classification” to you.

If you are working in marketing/sales departments, you want to know who are likely to buy your products and services. If you are in legal services, you would like to know who wins the case in a court. If you are in financial industries, you would like to know who will be in default among your loan customers.

These cases are considered as same problems as “classfication”.  It means that you can classify a thing or an event you are interested in from all populations you have on hand.  If you have data about who bought your products and services in the past, we can apply “classification” to predict who are likely to buy and make better business decisions. Based on the results of classification,  you can know who is likely to win cases and who will be in default with a numerical measure of certainty,  which is called “probability”.  Of course, “classification” can not be a fortune teller.  But “classification” can provide us who is likely to do something or what is likely to occur with some probabilities.  If your customer has 90% of probabilities based on “classification”, it means that they are highly likely to buy your products and services.


I would like to tell several examples of “classification” for each business. You may want to know the clues about the questions below.

  • For the sales/marketing personnel

What is the movie/music in the Top 10 ranking in the future?

  • For personnel in the legal services

Who wins the cases ?

  • For personnel in the financial industries or accounting firms

Who will be in default in future?

  • For personnel in healthcare industries

Who is likely to have a disease or cure diseases?

  • For personnel in asset management marketing

Who is rich enough to promote investments?

  • For personnel in sports industries

Which team wins the world series in baseball?

  • For engineers

Why was the spaceship engine exploded in the air?


We can consider a lot of  examples more as long as data is available.  When we try to solve these problems above,  we need data in the past, including the target variable, such as who bought products, who won the cases and who was default in the past.  Without data in the past, we can predict nothing. So data is critically important for “classification” to make better business decisions.   I think data is “King”.


Technically, several methods are used in classification.  Logistic regression,  Decision trees,  Support Vector Machine and Neural network and so on. I recommend to learn Logistic regression first as it is simple, easy to apply real problems and can be basic knowledge to learn more complex methods such as neural network.


I  would like to explain how classification works in the coming weeks.  Do not miss it!  See you next week!

IBM Watson Analytics works well for business managers !

architecture-21589_1280

IBM Watson Analytics was released at 4th Dec 2014.  This is new service where data analysis can be done with conversations and no programming is needed.  I am very interested in this service so I opened my account of IBM Watson Analytics and reviewed it for a week. I would like to make sure how this service works and whether it is good for business manager with no data analysis expertise. Here is a report for that.


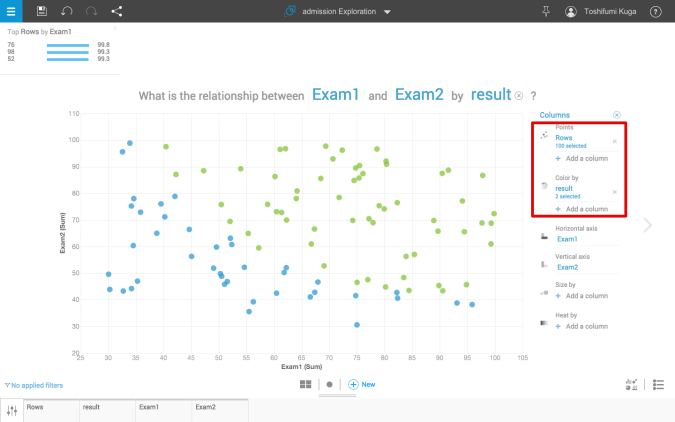
I think IBM Watson Analytics is good for beginners of data analysis because it is easy to visualize data and we can do predictive analysis without programming the codes. I used the data which includes  score of exam1, exam2 and results of admission.  This data can be obtained at Exercise 2 of Machine Learning at coursera.  Here is the chart drawn by IBM Watson Analytics. In order to draw this chart, All have to do is uploading data, write or choose “what is the relationship between Exam1 and Exam2 by result”, and adjust some options in red box below. In the chart,  green point means ‘admitted’ and blue point means ‘not admitted’. Therefore it enable us to understand what the data means easily.

watson2


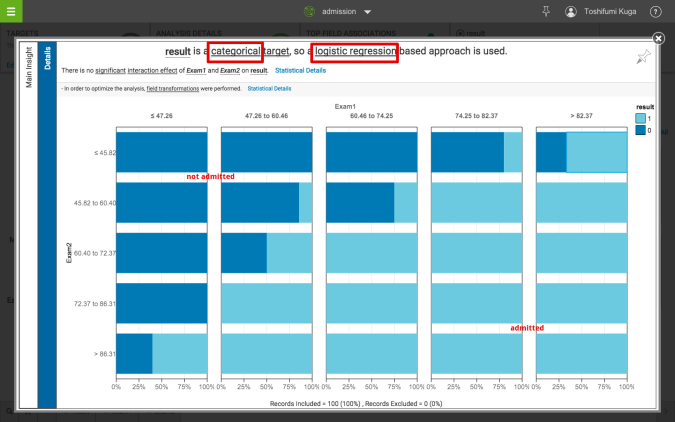
Let us move on prediction.  We can analyze data in details here because statistical models are running behind it.  I decided “result” is a target in this analysis.   This target is categorical as it includes only “1:admitted and 0:not admitted” so logistic regression model, which is one of the classification analysis, is chosen automatically by IBM Watson Analytics.  Here is the results of this analysis. In the red box, explanations about this analysis is presented automatically. According to the matrix about score of each exam, we can estimate probability of admission. It is good for business manager as this kind of analysis usually requires  programming with R or MATLAB, python.

watson4


In my view, logistic regression is the first model to learn classification because it is easy to understand and can be applied to a lot of fields. For example I used this model to analyze how the counter parties are likely to be in default when I worked at financial industries.  For marketing,  the target can be interpreted as buy the product or not.  For maintenance of machines,  the target can be interpreted as normal or fail. The more data are corrected, the more we can apply this classification analysis to. I hope many business managers can be familiar with logistic regression by using IBM Watson Analytics.

IBM Watson Analytics has just started now so improvements may be needed to make the service better. However, it is also true that business manager can analyze data without programming by using IBM Watson Analytics.  I would like to highly appreciate the efforts made by IBM.


Note:IBM, IBM Watson Analytics, the IBM logo are trademarks of International Business Machines Corporation, registered in many jurisdictions worldwide. 

Mobile services will be enhanced by machine learning dramatically in 2015, part 2

iphone-518101_1280

Happy new year !   At the beginning of 2015,  it is a good time to consider what will happen in the fields of machine learning and mobile services in 2015.  Followed by the blog last week,  we consider recommender systems and internet of things as well as investment technologies. I hope you can enjoy it !


3. Recommender systems

Recommender systems are widely used from big companies such as amazon.com and small and medium-sized companies.  Going forward,  as image recognition technology progresses rapidly, consumer generated data such as pictures and videos must be taken to analyze consumers behaviors and construct consumers preferences effectively.  It means that unstructured data can be taken and analyzed by machine learning in order to make recommendations more accurate. This creates a virtuous cycle. More people take pictures by smartphones and send them thorough the internet, more accurate recommendations are.  It is one of the good examples of personalization. In 2015 a lot of mobile services have functions for personalization so that everyone can be satisfied with mobile services.


4. Internet of things

This is also one of big theme of the internet.  As sensors are smaller and cheaper,  a lot of devices and equipments from smart phone to automobile have more sensors in it. These sensors are connected to the internet and send data in real-time basis.  It will change the way to maintain equipments completely.  If fuel consumption efficiency of your car is getting worse, it may be caused by failure of engines so maintenance will be needed as soon as possible. By using classification algorithm of machine learning, it must be possible to predict fatal failure of automobiles, trains and even homes.  All notifications will be sent to smartphones in real-time basis. It leads to green society as efficiency are increasing in terms of energy consumption and emission control.


5. Investment technology

I have rarely heard that new technologies will be introduced in investment and asset management in 2014 as far as I concerned.  However I imagine that some of fin-tech companies might use reinforcement learning, one of the categories of machine leaning.  Unlike the image recognition and machine translation, right answers are not so clear in the fields of investment and asset management. It might be solved by reinforcement learning  in practice in order to apply machine learning into this field. Of course, the results of analysis must be sent to smart phone in real-time basis to support investment decisions.


Mobile services will be enhanced in 2015 dramatically because machine learning technologies are connected to mobile phone of each customer. Mobile service with machine learning will change the landscape of each industries sooner rather than later. Congratulations!