What is the marketing strategy at the age of “everything digital”?

presentation-1311169_640

In July,  I have researched TensorFlow, which is a deep learning library by Google, and performed several classification tasks.  Although it is open-source software and free for everyone, its performance is incredible as I said in my last article.

When I perform image classification task with TensorFlow,  I found that computers can see our world better and better as deep learning algorithms are improved dramatically. Especially it is getting better to extract “features“, what we need to classify images.

Images are just a sequence of numbers for computers. So some features are difficult for us to understand what they are. However computers can do that. It means that computers might see what we cannot see in images. This is amazing!

Open CV


Open CV2

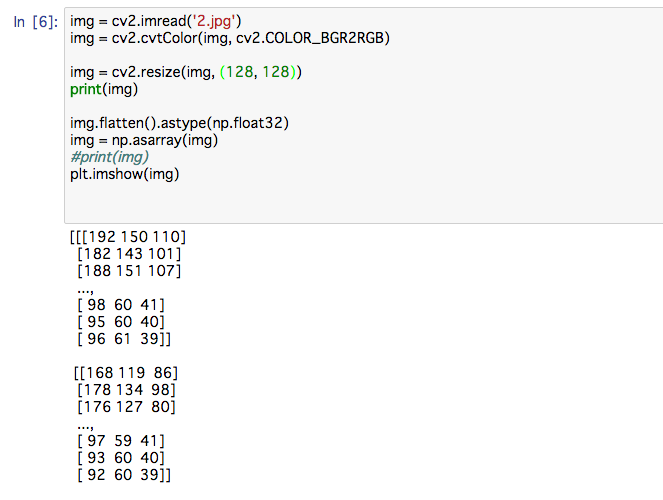
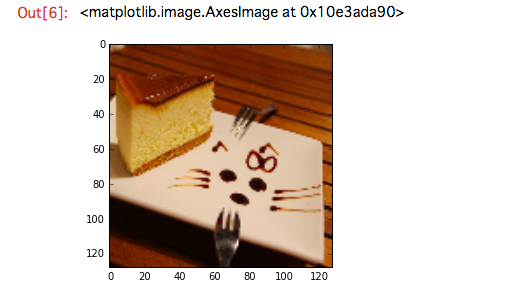
This is an example “how images are represented as a sequence of numbers. You can see many numbers above (These are just a small part of all numbers). These numbers can be converted to the image above which we can see. But computers cannot see the image directly.  It can only see the image through numbers above. On the other hand, we can  not understand the sequence of numbers above at all as they are too complicated. It is interesting.

In marketing,  when images of products are provided,  computers might see what are needed to improve the products and to be sold more. Because computers can understand these products more in a deferent way as we do. It might give us new way to consider marketing strategy.  Let us take T shirts as an example. We usually consider things like  color, shape,  texture,  drawings on it,  price. Yes, they are examples of “features” of T shirts because T-shirts can be represented by them. But computers might think more from the images of T shirts than we do. Computers might create their own features of T-shirts.


Then, I would like to point out three things to consider new marketing strategy.

1.Computers might extract more information that we do from same images.

As I explained, computers can see the images in a different way as we do. We can say same things for other data, such as text or voice mail as they are also just a sequence of numbers for computers. Therefore computers might understand our customers behavior more based on customer related data than we do when deep learning algorithms are much improved. We sometimes might not understand how computers can understand many data because computers can understand text/speech as a sequence of numbers and provide many features that are difficult to explain for us.


2.Computers might see many kind of data as massive amount data generated by costomers

Not only images but also other data, such as text or voice mail are available for computers as they are also just a sequence of numbers for computers. Now everything from images to voice massages is going to digital.  I would like to make computers understand all of them with deep learning. We cannot say what features are used when computers see images or text in advance. But I believe some useful and beneficial things must be found.


3. Computers can work in real-time basis

As you know, computers can work 24 hours a day, 365 days a year. Therefore it can operate in real-time basis. When new data is input, answer can be obtained in real-time basis. This answer can be triggered next actions by customers. These actions also can be recorded as digital and fed to into computers again. Therefore many digital data will be generated when computers are operated without stop /rest time and the interactions with customers might trigger chain-reactions. I would like to call it “digital on digital”


Images, social media, e-mails from customers, voice mail,  sentences in promotions, sensor data from customers are also “digital”. So there are many things that computers can see. Computers may find many features to understand customer behaviors and preferences in real-time basis. We need to have system infrastructures to enable computers to see them and tell the insight from them. Do you agree with that?


Notice: TOSHI STATS SDN. BHD. and I do not accept any responsibility or liability for loss or damage occasioned to any person or property through using materials, instructions, methods, algorithm or ideas contained herein, or acting or refraining from acting as a result of such use. TOSHI STATS SDN. BHD. and I expressly disclaim all implied warranties, including merchantability or fitness for any particular purpose. There will be no duty on TOSHI STATS SDN. BHD. and me to correct any errors or defects in the codes and the software.


The reason why computers may replace experts in many fields. View from “feature” generation.

public-domain-images-free-stock-photos-aureliejouan-lights

Hi friends, I am Toshi. I updated my weekly letter.  Today I explain 1. How classification, do or do not, can be obtained with probabilities and 2. Why computers may replace experts in many fields from legal service to retail marketing.   These two things are closely related to each other. Let us start now.


1.  How can classification be obtained with probabilities?

Last week, I explained that “target” is very important and “target” is expressed by “features”.  For example Customer “buy” or “not buy” may be expressed by customers age and  the number of  overseas trips a year.  So I can write this way : “target” ← “features”.   This week, I try to show you the value of “target” can be a probability, which is  a number between 0 and 1.  If the “target” is closer to “1”,  the customer is highly likely to buy.   If the target is closer to “0”,  the customer is less likely to buy.   Here is our example of “target” and “features” in the table below.

customer data

I want  Susumu’s value of the “target” to be close to “1” in calculations by using “features”.  How can we do that?   Last week we added “features” with“weight” of each feature.   For example  (-0.2)*30+0.3 *3+6,  the answer is 0.9.  “-0.2″ and “0.3” are the weight for each feature respectively. “6” is a kind of adjustment.  Next let us introduce this curve below. In the case of Susumu, his value from his features is 0.9. So let us put 0.9 on the x-axis, then what is the value of y? According to this  curve, the value of y is around 0.7. It means that  Susumu’s probability of buying products is around 0.7.  If probability is over 0.5, it is generally considered that customer is likely to buy.

logistic1

In the case of Tom, I want his value of the “target” to be close to “0” in calculations by using “features”.  Let us add his value of features as follows  (-0.2) *56+0. 3 *1+6,  the answer is -4.9.  His value from his features is -4.9. So let us put  -4.9 on the x-axis, then what is the value of y?  According to this curve, Tom’s probability of buying products is almost 0. Unlike Susumu’s case, Tom is less likely to buy.

logistic2

This curve is called “logistic curve“.   It is interesting that whatever value “x” takes, “y” is always between 0 and 1.  By using this curve, everyone can have the value between 0 and 1, which is considered as the probability of the event. This curve is so simple and useful that it is used in many fields.  In short, everyone has a probability of buying products, which is expressed as the value of “y”.  It means that we can predict who is likely to buy in advance as long as “features”are obtained! The higher value customers have, the more likely they will buy the products.


2.  Why may computers replace experts in many fields?

Now you understand what are”features”.  “Features” generally are set up based on expert opinion. For example, if you want to know who is in default in the future, “features”needed are considered “annual income”, “age”, “job”, “the past delinquency” and so on. I know them because I used to be a credit risk manager in consumer finance company in Japan.  Each expert can introduce the features in the business and industries.  That is why the expert’s opinion is valuable, so far. However, computers are also creating their features based on data. They are sometimes so complex that no one can understand them. For example, ” -age*3-number of jobs in the past” has no meaning for us. No one knows what it means. But computers do. Sometimes computers can predict “target”, which means “do” or “not do” with their own features more precisely than we do.


In the future,  I am sure much more data will be available to us.  It means computers have more chance to create better “features” than experts do. So experts should use the results of predictions by computers and introduce them into their insight and decisions in each field.  Otherwise, we cannot compete with computers because computers can work 24 hours/day and 365 days/year. It is very important that the results of predictions should be used effectively to enhance our own expertise in future.


Notice: TOSHI STATS SDN. BHD. and I, author of the blog,  do not accept any responsibility or liability for loss or damage occasioned to any person or property through using materials, instructions, methods, algorithm or ideas contained herein, or acting or refraining from acting as a result of such use. TOSHI STATS SDN. BHD. and I expressly disclaim all implied warranties, including merchantability or fitness for any particular purpose. There will be no duty on TOSHI STATS SDN. BHD. and me to correct any errors or defects in the codes and the software.

Easy way to understand how classification works without formula! no.1

public-domain-images-free-stock-photos-high-quality-resolution-downloads-around-the-house-18

Hello, I am Toshi. Hope you are doing well. Last week  I introduced “classification” to you and explained it can be applied to every industry. Today I would like to explain how it works step by step  this week and next week. Do not worry, no complex formula is used today.  It is easier than making pancakes with fry pan!

I understand each business manager have different of problems and questions. For example, if you are a sales manager in retail, you would like to know who is likely to buy your products.  If you are working in banks, you want to know who will be in default. If you are in the healthcare industries, who is likely to have diseases in future.  It is awesome for your business if we can predict what happens with certainty in advance.

These problems look like different from each other. However, they are categorized as same task called “classification” because we need to classify “do” or “do not”.  For sales managers, it means that “buy” or “not buy”. For managers in banks,  “in default” or “not in default”. In personnel in legal service, “win the case” or “not win the case”.  If predictions about “do” or “do not” can be obtained in advance.  It can contribute to the performance  of your businesses. Let us see how it is possible.


1.  “target” is significantly important

We can apply “do” or ” do not” method to all industries. Therefore, you can apply it to your own problems in businesses.  I  am sure you are already interested in  your own “do” or ” do not”.   Then let us move on to data analysis.  “Do” or “do not” is called “target” and has a value of  “1” or “0”.  For example, I bought premium products in a retail shop,  In such a case,  I have “1” as  a target.  On the other hand, my friend did not buy anything there.  So she has “0”  as a target.   Therefore  everyone should have “1” or “0” as a target.   It is very important as a starting point.  I recommend to consider what is a good  “target” in your businesses.


2.  What are closely related to “target”?

This is your role because you have expertise in your business.  It is assumed that you are sales manager of retail fashion. Let us imagine what are closely related to the customer’s “buy” or “not buy”.  One of them may be customers’ age because younger generation may buy more clothes than senior.  Secondly, the number of  overseas trips a year because the more they travel overseas, the more clothes they buy.  Susumu, one of my friends, is 30 years old and travels overseas three times a year.  So his data is just like this : Susumu  (30, 3).  These are called “features”.   Yes, everyone has different values of the features. Could you make your own values of features by yourself?  Your value of the features must be different from (30,3).  Then, with this feature (30, 3),  I would like to express “target” next.  (NOTE: In general,  the number of features is far more than two. I want to make it simple to understand the story with ease.)  Here is our customer data.

customer data

3.  How “targets” can be expressed with “features”?

Susumu has his value of features (30, 3).  Then let us make the sum of  30 and 3. The answer is 33.  However, I do not think it works because each feature has same impact to “target”.  Some features must have more impact than others. So let us introduce “weight” of each feature.   For example  (-0.2)*30+0.3 *3+6,  the answer is 0.9.  “-0.2” and “0.3” are the weight for each feature respectively. “6” is a kind of adjustment. This time it looks better as “age” has a different impact from “the number of travels”against “target”.  So “target”, which means in this case Susume will buy or not,  is expressed with features, “age” and  “the number of travels”.  Once it is done, we do not need to calculate by ourselves anymore as computers can do that instead of us. All we have to know is “target” can be expressed with “features”.  Maybe I can write this way : “target” ← “features”.   That is all!


Even if the number of features is more than 1000, we can do the same thing as above.  First, put the weight to each feature, second, sum up all features with each weight.  Therefore, you understand how a lot of data can be converted to  just “one value”.  With one value, we can easily judge whether Susumu is likely to buy or not.  The higher value he has,  the more likely he will buy clothes. It is very useful because it enables us to intuitively know whether customers will buy or not.

Next week I would like to introduce “Logistic regression model” and explain how it can be classified quantitatively.   See you next week!