“Classification” is significantly useful for our business, isn’t it?

public-domain-images-free-stock-photos-high-quality-resolution-downloads-public-domain-archive-14

Hello, I am Toshi. Hope you are  doing well. Now I consider how we can apply data analysis to our daily businesses.  So I would like to introduce “classification” to you.

If you are working in marketing/sales departments, you want to know who are likely to buy your products and services. If you are in legal services, you would like to know who wins the case in a court. If you are in financial industries, you would like to know who will be in default among your loan customers.

These cases are considered as same problems as “classfication”.  It means that you can classify a thing or an event you are interested in from all populations you have on hand.  If you have data about who bought your products and services in the past, we can apply “classification” to predict who are likely to buy and make better business decisions. Based on the results of classification,  you can know who is likely to win cases and who will be in default with a numerical measure of certainty,  which is called “probability”.  Of course, “classification” can not be a fortune teller.  But “classification” can provide us who is likely to do something or what is likely to occur with some probabilities.  If your customer has 90% of probabilities based on “classification”, it means that they are highly likely to buy your products and services.


I would like to tell several examples of “classification” for each business. You may want to know the clues about the questions below.

  • For the sales/marketing personnel

What is the movie/music in the Top 10 ranking in the future?

  • For personnel in the legal services

Who wins the cases ?

  • For personnel in the financial industries or accounting firms

Who will be in default in future?

  • For personnel in healthcare industries

Who is likely to have a disease or cure diseases?

  • For personnel in asset management marketing

Who is rich enough to promote investments?

  • For personnel in sports industries

Which team wins the world series in baseball?

  • For engineers

Why was the spaceship engine exploded in the air?


We can consider a lot of  examples more as long as data is available.  When we try to solve these problems above,  we need data in the past, including the target variable, such as who bought products, who won the cases and who was default in the past.  Without data in the past, we can predict nothing. So data is critically important for “classification” to make better business decisions.   I think data is “King”.


Technically, several methods are used in classification.  Logistic regression,  Decision trees,  Support Vector Machine and Neural network and so on. I recommend to learn Logistic regression first as it is simple, easy to apply real problems and can be basic knowledge to learn more complex methods such as neural network.


I  would like to explain how classification works in the coming weeks.  Do not miss it!  See you next week!

Can we talk to computers without programming language?

astronaut-568620_1280

IBM announced that Watson analytics provides us data analysis and visualization as a service without programming at 4th Dec 2014. It said that “breakthrough natural language-based cognitive service that can provide instant access to powerful predictive and visual analytic tools for businesses, is available in beta”.  Let us consider what kind of impacts IBM Watson analytics provides us.


Watson analytics is good at doing natural language processing.  For example,  if doctors ask Watson analytics how to cure the disease, Watson analytics understand the questions from doctors, research massive data and answer the questions. There is no need to program codes by doctors. It means that we may change from “we should learn computer programming” to “we should know how to have a conversation with computers”.  It may enable a lot of non-programming persons to use computers effectively.

In addition to that,  Watson analytics is also good at handling unstructured data.  These data include text, image, voice and video.  Therefore Watson analytics can analyze e-mail, social media contents, pictures taken by consumers.  So It may be possible to recommend what we should eat at restaurants by taking pictures of menus there, because computers have our health data and they can choose the best meals for our health by analyzing the pictures of menus.

In terms of algorithm,  these functionalities above can be achieved by machine learning.  So the more people start using this service, the more accurate answers by computers are because computers learn from a lot of data and are getting better.


IBM Watson analytics may change the landscape of every industry.  Traditionally data analysis can be executed by data scientists, using numerical data and programming languages. However this new kind of data analysis by IBM Watson analytics,  data analysis can be executed by businessmen/women, using e-mail, pictures and video and natural languages.  Machine translation from one language to another will be also available therefore there are less language barrier going forward.  This must be democratization for data analysis. It is exciting when it happens in 2015 !


Note:IBM, the IBM logo are trademarks of International Business Machines Corporation, registered in many jurisdictions worldwide. 

Mobile services will be enhanced by machine learning dramatically in 2015, part 2

iphone-518101_1280

Happy new year !   At the beginning of 2015,  it is a good time to consider what will happen in the fields of machine learning and mobile services in 2015.  Followed by the blog last week,  we consider recommender systems and internet of things as well as investment technologies. I hope you can enjoy it !


3. Recommender systems

Recommender systems are widely used from big companies such as amazon.com and small and medium-sized companies.  Going forward,  as image recognition technology progresses rapidly, consumer generated data such as pictures and videos must be taken to analyze consumers behaviors and construct consumers preferences effectively.  It means that unstructured data can be taken and analyzed by machine learning in order to make recommendations more accurate. This creates a virtuous cycle. More people take pictures by smartphones and send them thorough the internet, more accurate recommendations are.  It is one of the good examples of personalization. In 2015 a lot of mobile services have functions for personalization so that everyone can be satisfied with mobile services.


4. Internet of things

This is also one of big theme of the internet.  As sensors are smaller and cheaper,  a lot of devices and equipments from smart phone to automobile have more sensors in it. These sensors are connected to the internet and send data in real-time basis.  It will change the way to maintain equipments completely.  If fuel consumption efficiency of your car is getting worse, it may be caused by failure of engines so maintenance will be needed as soon as possible. By using classification algorithm of machine learning, it must be possible to predict fatal failure of automobiles, trains and even homes.  All notifications will be sent to smartphones in real-time basis. It leads to green society as efficiency are increasing in terms of energy consumption and emission control.


5. Investment technology

I have rarely heard that new technologies will be introduced in investment and asset management in 2014 as far as I concerned.  However I imagine that some of fin-tech companies might use reinforcement learning, one of the categories of machine leaning.  Unlike the image recognition and machine translation, right answers are not so clear in the fields of investment and asset management. It might be solved by reinforcement learning  in practice in order to apply machine learning into this field. Of course, the results of analysis must be sent to smart phone in real-time basis to support investment decisions.


Mobile services will be enhanced in 2015 dramatically because machine learning technologies are connected to mobile phone of each customer. Mobile service with machine learning will change the landscape of each industries sooner rather than later. Congratulations!


What is singular value decomposition?

binary-code-507790_1920

Last week I introduced inner product as a simple model in recommender systems. This week I would like to introduce more advanced model for recommender systems. It is called singular value decomposition.


According to Mining Massive datasets in Coursera, one of the best on-line courses about machine learning and big data,  singular value decomposition or SVD is defined as follows.

Matrix A=UΣV’

U : left singular matrix

Σ : singular matrix

V : right singular matrix

Row vectors and column vectors of matrix A can be transformed into lower dimensional space. This space is called “concept”. In other words row vectors and column vectors can be mapped to concept space, which has smaller dimensions than row and column vectors of matrix A. Strength of each concept is defined in singular matrix where diagonal values are positive. When SVD is applied to recommeder systems,  row vectors of matrix A can be customers’ preference and column vectors can be items features.  For example, movies can be classified as a SF movie or a romance movie, which are “concept”.   Each customer may like SF movies or romance movies. We can predict unknown rating for customers and items by using SVD.


SVD is also used for dimensionality reduction and advantages of  SVP are as follows.

1.  find hidden correlations

2.  make visualization of data easier

3.  reduce the amount of data


Therefore SVD can be applied to not only recommender system but other kinds of business applications.


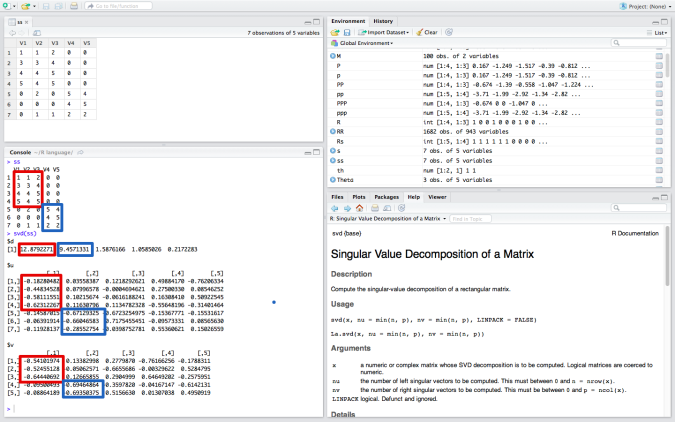
Let us see R to analyze data by singular value decomposition. R has a function of  singular value decomposition, SVD. Therefore we can execute singular value decomposition by just inputting data into function of svd() in R. IDE below is RStudio.

SVD 1

In this case,  matrix ss is decomposed into $d,$u and $v.

$u : left singular matrix

$d:  singular matrix

$v : right singular matrix

When we look at $d,  value of the first and second column are large, therefore we focus on the first concept and second concept.  In $u, the row vectors of ss are mapped to concept space.  In $v, the column vectors of ss are also mapped to same concept space.  Red rectangular and blue rectangular show similarity based on “concept”. I recommend you to try svd() to analyze data in R as it is very easy and effective.

SVD is a little complicated than inner product but it is very useful when there are a lot of data which has large dimensions. Let us be familiar with SVD because we would like to use this model going forward.

Recommender engines and inner product

cinema-64154_1920

Last week, I introduced inner product of vectors as an essential tool for statistical models.  Let us apply inner product to recommender engines this week.


Could you remember a utility function?  Let me review it a little here. The utility function is expressed as follows.

U:θ*x→R

U:utility of customers,  θ:customers’preferences,  x:Item features,  R:ratings of the items for the customers

As you know,  θ:customers’preferences,  x:Item features, both are vectors.  Let us take an example of movies. Movie features are expressed as follows.


A1: Science fiction movie

A2: Love romance movie

A3.: Historical movie

A4: US movie

A5: Japanese movie

A6: Hong Kong movie

θ,x=[A1,A2,A3,A4,A5,A6]


First let us consider customer’s preferences. If you like some of the features of movies, assign 1 to the features.  If you like them very much, assign 2,  if you do not like it, just put 0 to the features.  I like Science fiction movie and US movie very much and like Japanese and Hong Kong movie,  while I do not like love romance movie and historical movie. These preferences can be expressed as a vector. My preference vector θ is [2,0,0,2,1,1] because A1=2, A2=0, A3=0,A4=2, A5=1, A6=1 according to my preference. I recommend you to make your own preference vector the same way as I did here.


Then let us move on to item features.  StarWars, A Chinese ghost story, Seven samurai and Titanic are taken as our selections of movies. Then what movies are recommended to me?

OK, let us make item feature vector of each movie. For example, if the movie is US movie, A4=1, A5=0, A6=0.

StarWars : x=[1,0,0,1,0,0]

A Chinese ghost story : x=[0,1,0,0,0,1]

Seven samurai : x=[0,0,1,0,1,0]

Titanic : x=[0,1,0,1,0,0]


Finally, let us calculate the value of the utility function for each movie. If the value is bigger, it means that I like this movie more and recommendations should be provided for me to watch the movie.  The value can be obtained by calculate inner product of  θ:customers’preferences and  x:Item features.  In StarWars case, the value of utility function is [2,0,0,2,1,1]*[1,0,0,1,0,0]’ = 4.


StarWars : U=4

Chinese ghost story : U=1

Seven samurai : U=1

Titanic : U=2


So the highest value goes to StarWars. So it should be recommended to me. the second is Titanic so it may be recommended. If you prepare your own preference vector, you can calculate the value of your utility functions and find what movie should be recommended to you !


Anyway this is one of the most simple model to calculate the value of utility for each movie. It uses inner product of vectors as I said before. Inner product can transform a lot of data into a single number. In this case, only six features are selected. Even thought number of features can be far more than six, inner product can transform a lot of data into a single number, which can be used for better business decisions!

The function of statistical models and inner product

binary-368715_1280

Before we dive into liner regression model, let us consider functions of statistical models.  It is obvious that we are already surrounded by a lot of data,  web-logs, search engine query, location data from smartphones, and so on.  We cannot understand what they mean for us by just looking at them because they are massive of amount data. Then what should we do in order to understand them and make better business decisions?  We tend to lose our sights as massive data has too much information to us.  How can we reduce the dimensions of the data so that we can understand what they mean?


Here I would like to introduce inner product. It is sometimes called dot product. I would like to refer to the definition of inner product according to Wikipedia.

In mathematics, the dot product, or scalar product (or sometimes inner product in the context of Euclidean space), is an algebraic operation that takes two equal-length sequences of numbers (usually coordinate vectors) and returns a single number.

This “a single number” is very important for us because we can understand what “a number” means. By using inner product, we can put a lot data into a single number.  From 2 or 3 data to one million or billion data,  we can convert a lot of data into a single number.  Is it wonderful, isn’t it?  we can understand data if it is only a single number!

It is simple but we can apply it to a lot of statistical models.  For example, liner regression model,  logistic regression model, support vector machine, and so on.

Inner product has an essence of functions of statistical models.  It can convert a lot of data into a single number, which we can understand.  This is what we want because we are surrounded by a lot of data now!


So going forward, I would like to focus on inner product when new statistical models are introduced. It enable us to understand how statistical models work!  Especially for beginners of data analysis, I strongly recommend to get familiar with inner product. Then we can go to next phase and introduce liner regression model next week !

How can beginners learn computer programming easily?

binary-65473_1280


Machine learning as a service is started by Microsoft Azure.  It seems that we can analyze data without writing code.  Does this mean we do not need to learn the computer programming anymore ?  I do not think so.  Because computer programming is needed to add new functions and provide fine tune to existing statistical models.  This is like driving cars.  Although there is no need to do “gear changes” manually,  we can run faster with gear changed manually when drivers have skills.  In addition to that, learning programming is learning how the calculation is done on computers.  The more you learn programming, the more you can understand methods of calculations in computers.  So do not be away from computer programming.

For beginners, however, it is not easy to start computer programming. There are a lot of books and manuals about computer programming.    Unfortunately, most of them are written for engineers and programmers, rather than beginners. So I would like to consider how beginners learn computer programing with ease.


1.  Do not hesitate to re-learn high school math

First, we should consider how problems can be solved and results can be obtained.  It is called “algorithm”.  Algorithms usually are expressed by mathematical formulas.  Whether therefore you may like math or not,  knowledge about elementary math, especially vectors and matrix is needed in computer programing.  Data is stored by using “Vectors and Matrix”, so it is very important to be familiar with Vectors and Matrix in advance.  The calculus is also important and provided strong recommendations to learn.  Most of the knowledge needed can be obtained through high school math textbooks. No need to solve complex problems,  just read textbooks and understand how they work. With math, we can prove “algorithm” is right.  It is a shortcut to learn computer programming.


2.  Let us be familiar to manipulate “Vectors and Matrix”

Finally algorithm should be implemented on computers. This is the last step you which is overcome. In computer programming,  “X” does not mean one number such as “1”, “64” but group of  numbers “2”,”56″,”789″.  It makes presentations of data simple and easy if you can understand how it works.  So be familiar to present matrix using “X”, “Y” even though each of them looks one number. This is the key concept for beginners to understand how data analysis is processed on computers.


3. Exercise computer programming without a computer

You do not need to sit down in front of computers in learning computer programing.  Just a piece of paper and a pen are needed.  Let us write down the algorithm you learned before. If you understand it with 120%, you can write code from the beginning to the end correctly.  Anytime and anywhere we can learn computer programming using  a piece of paper and a pen.


Anyway,  do not be shy to computer programing and just start it step by step.  You might be an expert of this field in the future. Good Luck!!

Challenge to Machine Learning

home-office-336373_640

Machine Learning is getting famous and attractive to analyze big data.  It has a long history to be developed as the algorithm since 1950s.  However machine learning gets a spotlight among data scientist recently because  a lot of data,  computer resources and data storage, which are necessary for machine learning, has been available with reasonable costs.    I would like to introduce a basic algorithm of Machine Learning by using R language,  which I recommended before.

1.  Problem sets

Observed data x= [1,2,3] and y= [5,7,9].  Then I would like to find what are a and b when I assume that it can be expressed  y=ax+b.  Yes, it is obvious that a=2 and b=3, however, I want this solution by using algorithms to calculate them.


2. Algorithm

This is my program of machine learning to find what  a and b are.  I would like to focus on Bold part of the program.

First step      :       update parameters

Second step :       calculate the updated value of the cost function by the updated parameters

Third step    :       compare the updated value with the old value of the cost function and stop calculation if it is considered as convergence

Go back to the first step above.

These three steps above are generally used in machine learning algorithms. So it is useful if you can remember them.


ML<-function(le){

x=matrix(c(1,1,1,1,2,3),3,2)
y=matrix(c(5, 7, 9),3,1)
t=matrix(1,2,1)
m=length(y)
h=x%*%t
j=1/(2*m)*(t(h-y)%*%(h-y))

for (i in seq(1,1000)){
h=x%*%t
tnew=t-le/m*t(x)%*%(h-y)
hnew=x%*%tnew
jnew=1/(2*m)*(t(hnew-y)%*%(hnew-y))
if (abs(jnew-j)<=10^(-8)) break
t=tnew
j=jnew
print(i)
print(t)
end
}
}


3.  The result of calculation

I use  le=0.1 as a learning rate.  Then I get the result of the calculation below.

[1] 521

[,1]
[1,] 2.997600
[2,] 2.001056

This means that the value of the cost function is convergent at 521 time calculations.  a = 2.001056 and b =  2.997600.    They are very close to true values a=2 and b=3.  So it is considered that this algorithm can find the solutions.


This algorithm is one of the most simple ones. However, it includes the fundamental structure which can be applied to other complex algorithms.  So I recommend you to implement this by yourself and be familiar with this kind of algorithms.  In short, 1. Update parameters  2. Calculate the updated value of cost function  3. Make sure updated value is convergent.   Yes, it is so simple!

TOSHI STATS SDN. BHD. and I do not accept any responsibility or liability for loss or damage occasioned to any person or property through using algorithms, instructions, methods or ideas contained herein, or acting or refraining from acting as a result of such use. TOSHI STATS SDN. BHD. and I expressly disclaim all implied warranties, including merchantability or fitness for any particular purpose. There will be no duty on TOSHI STATS SDN. BHD. and me to correct any errors or defects in the codes and the software.

Do you want to be “Analytic savvy manager”?

Data is and will be around us and it is increasing at an astonishing rate.  In the such business environment,  what should business managers do?    I do no think every manager should have an analytics skill at the same level as a data scientist because it is almost impossible.  However, I do think every manager should communicate with data scientists and make better decisions by using output from their data analysis.  Sometimes this kind of manager is called “analytic savvy manager”.  Let us consider what “analytic savvy manager”should know.


1.   What kind of data is available to us?

Business managers should know what kind of data is available for their business analysis.  Some of them are free and others are not.  Some of them are in  companies or private and others are public.  Some of them are structured and others are not.  It is noted that data which are available is increasing in terms of volume and variety.  Data is a starting point of analysis, however, data scientists may not know specific fields of business in detail. It is business managers that know what data is available to businesses.  Recently data gathering services have provided us a lot of data for free.  I recommend you to look at “Quandl” to find public data. It is easy to use and provides a lot of public data for free.  Strong recommendation!


2.  What kind of analysis method can be applied?

Business managers do not need to memorize formulas of each analysis method.  I recommend business managers to understand simple linear regression and logistic regression and get the big picture about how the statistical models work. Once you are familiar with two methods,  you can understand other complex statistical models with ease because fundamental structures are not so different among methods.  Statistical models enable us to understand what big data means without loss of information.  In addition to that,  I also recommend business managers to keep in touch with the progress of machine learning,  especially deep learning.  This method has great performances and is expected to be used in a lot of business field such as natural language processing.  It may change the landscape of businesses going forward.


3.  How can output from analysis be used to make better decisions?

This is critically important to make a better decision.  Output of data analysis should be in aligned with business needs to make decisions.  Data scientist can guarantee whether numbers of the output are accurate in terms of calculations. However, they can not guarantee whether it is relevant and useful to make better decisions.  Therefore business managers should communicate with data scientist during the process of data analysis and make the output of analysis relevant to business decisions. It is the goal of data analysis.


I do not think these points above are difficult to understand for business managers even though they do not have a quantitative analytic background.   If you are getting familiar with these points above, it would make you different from others at the age of big data.

Do you want to be “Analytic savvy manager”?

13943376615435


What an excellent tool ” R ” is !

R language is an incredible statistic tool and have been improved on going.  10 years ago when I tried to exercise data analysis privately at home,  I used excel because my PC already had installed Microsoft Office as its initial setting. On the other hand, I used proprietary tools such as MATLAB in the companies where I worked.  MATLAB was an excellent tool to analyze data but the problem was its cost to keep them.  I could not pay this cost by myself as it was expensive to me,  therefore I was forced to use excel in my personal data analysis in my home.  There was no choice except that. I wished I would have MATLAB in my PC many times before. Many experts in the financial industry have written books about programming of MATLAB. However, I could not program it by myself at home as no MATLAB environment existed there.  So I was very surprised when I saw how R worked three years ago.  It can be downloaded without any fee and has the powerful functions in it. I can program freely and store them as my functions.  I decided to start learning R.  Now that I know how excellent R is and always recommend R for anyone who are interested in statistics and data analytics.


R has advantages compared to other tools

1.  R is available without any fee.

This is the biggest advantage to proprietary tools, especially for beginners of data analytics. With R, beginners have opportunities to have experience of data analytics by a tool used by professionals.  R lowers the barrier to enter the world of data analytics.  Many people start data analytics from their curiosity,  In such case, it is very difficult to invest a lot of money to own statistical tools.  Now there is no need to worry,  just go to R-project site and download R.  It is easy and available to everyone as long as one has an access to the internet.


2.  R is an open source

R is an open source, therefore, it is transparent and you can make your program as you want. When you make excellent programs,  you can make your programs available to anyone all over the world through Rproject site. If you go to this site, you can find many kinds of programs,  which covered from economics, finance to biostatistics.  These programs are called “package” and prepared by professionals all over the world and you can look at each code if you want.  According to R-project site there are more than five thousand packages and they are still increasing. No one knows what the real total number of programs is in R.  Fortunately, most programs are available to anyone without any cost.  It is wonderful for anyone who are interested in data analytics.


3.  There is a lot of information about R on the internet.

R is a good tool for learning statistics because there are a lot of tutorials, instructions and documents on the internet. Most of them are free  so you do not have to buy books about R.  It is one of the reasons why I set up my start up for digital learning of statistical computing. I prepare the introduction course to R. If you are interested in R, you can look at this,  of course, without any fee.


I drew this chart by R. It is fun to do that.  Let’s start R now !