Now I challenge the competition of data analysis. Could you join with us?

public-domain-images-free-stock-photos-high-quality-resolution-downloads-nashville-tennessee-21

Hi friends.  I am Toshi.  Today I update the weekly letter.  This week’s topic is about my challenge.  Last Saturday and Sunday I challenged the competition of data analysis in the platform called “Kaggle“. Have you heard of that?   Let us find out what the platform is and how good it is for us.


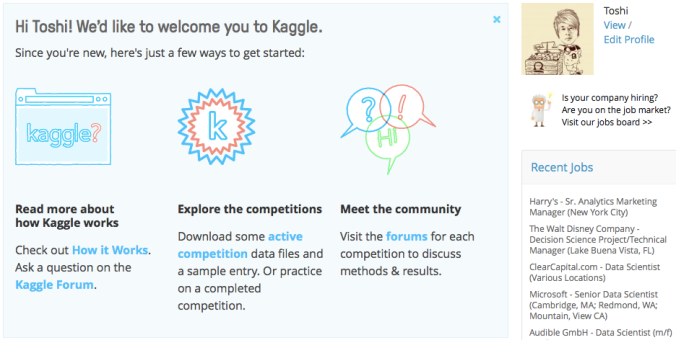
This is the welcome page of Kaggle. We can participate in many challenges without any fee.  In some competitions,  the prize is awarded to a winner. First, data are provided to be analyzed after registration of competitions.  Based on the data, we should create our models to predict unknown results. Once you submit the result of your predictions,  Kaggle returns your score and ranking in all participants.

K1

In the competition I participated in, I should predict what kind of news articles will be popular in the future.  So “target” is “popular” or “not popular”. You may already know it is “classification” problem because “target” is “do” or “not do”  type. So I decided to use “logistic curve” to predict, which I explained before.  I always use “R” as a tool for data analysis.

This is the first try of my challenge,  I created a very simple model with only one “feature”. The performance is just average.  I should improve my model to predict the results more correctly.

K3

Then I modified some data from characters to factors and added more features to be input.  Then I could improve performance significantly. The score is getting better from 0.69608  to 0.89563.

In the final assessment, the data for predictions are different from the data used in interim assessments. My final score was 0.85157. Unfortunately, I could not reach 0.9.  I should have tried other methods of classification, such as random forest in order to improve the score. But anyway this is like a game as every time I submit the result,  I can obtain the score. It is very exciting when the score is getting improved!

K4


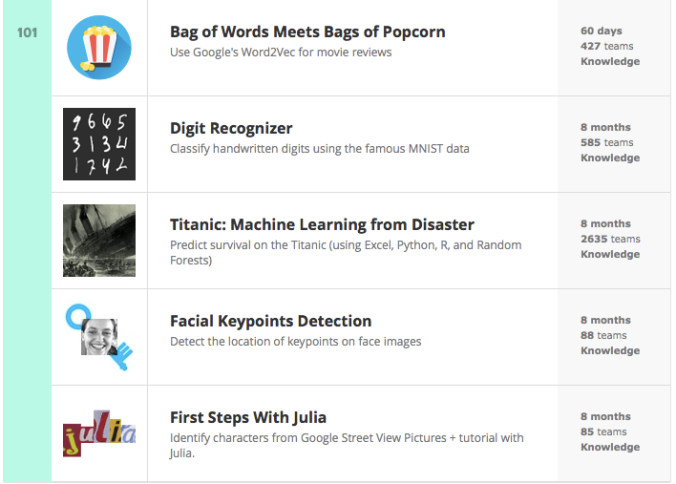
This list of competitions below is for the beginners. Everyone can challenge the problems below after you sign off.  I like “Titanic”. In this challenge we should predict who could survive in the disaster.  Can we know who is likely to survive based on data, such as where customers stayed in the ship?  This is also “classification”problem. Because the “target” is “survive”or “not survive”.

K2


You may not be interested in data-scientists itself. But it is worth challenging these competitions for everyone because most of business managers have opportunities to discuss data analysis with data-scientists in the digital economy. If you know how data is analyzed in advance, you can communicate with data-scientists smoothly and effectively. It enables us to obtain what we want from data in order to make better business decisions.  With this challenge I could learn a lot. Now it’s your turn!

Easy way to understand how classification works without formula! no.1

public-domain-images-free-stock-photos-high-quality-resolution-downloads-around-the-house-18

Hello, I am Toshi. Hope you are doing well. Last week  I introduced “classification” to you and explained it can be applied to every industry. Today I would like to explain how it works step by step  this week and next week. Do not worry, no complex formula is used today.  It is easier than making pancakes with fry pan!

I understand each business manager have different of problems and questions. For example, if you are a sales manager in retail, you would like to know who is likely to buy your products.  If you are working in banks, you want to know who will be in default. If you are in the healthcare industries, who is likely to have diseases in future.  It is awesome for your business if we can predict what happens with certainty in advance.

These problems look like different from each other. However, they are categorized as same task called “classification” because we need to classify “do” or “do not”.  For sales managers, it means that “buy” or “not buy”. For managers in banks,  “in default” or “not in default”. In personnel in legal service, “win the case” or “not win the case”.  If predictions about “do” or “do not” can be obtained in advance.  It can contribute to the performance  of your businesses. Let us see how it is possible.


1.  “target” is significantly important

We can apply “do” or ” do not” method to all industries. Therefore, you can apply it to your own problems in businesses.  I  am sure you are already interested in  your own “do” or ” do not”.   Then let us move on to data analysis.  “Do” or “do not” is called “target” and has a value of  “1” or “0”.  For example, I bought premium products in a retail shop,  In such a case,  I have “1” as  a target.  On the other hand, my friend did not buy anything there.  So she has “0”  as a target.   Therefore  everyone should have “1” or “0” as a target.   It is very important as a starting point.  I recommend to consider what is a good  “target” in your businesses.


2.  What are closely related to “target”?

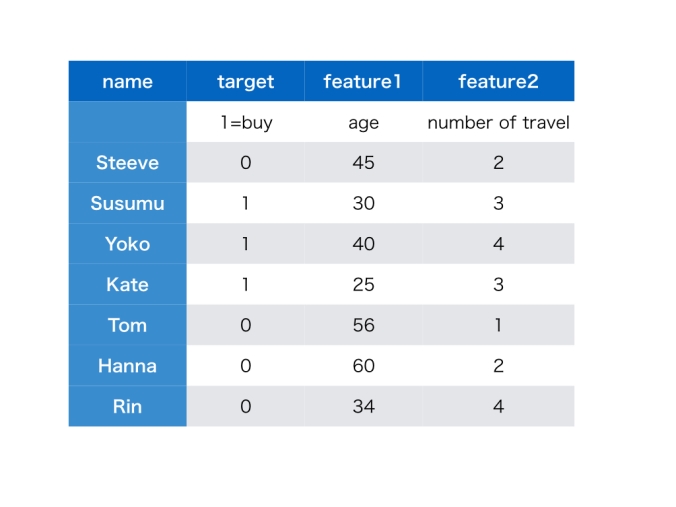
This is your role because you have expertise in your business.  It is assumed that you are sales manager of retail fashion. Let us imagine what are closely related to the customer’s “buy” or “not buy”.  One of them may be customers’ age because younger generation may buy more clothes than senior.  Secondly, the number of  overseas trips a year because the more they travel overseas, the more clothes they buy.  Susumu, one of my friends, is 30 years old and travels overseas three times a year.  So his data is just like this : Susumu  (30, 3).  These are called “features”.   Yes, everyone has different values of the features. Could you make your own values of features by yourself?  Your value of the features must be different from (30,3).  Then, with this feature (30, 3),  I would like to express “target” next.  (NOTE: In general,  the number of features is far more than two. I want to make it simple to understand the story with ease.)  Here is our customer data.

customer data

3.  How “targets” can be expressed with “features”?

Susumu has his value of features (30, 3).  Then let us make the sum of  30 and 3. The answer is 33.  However, I do not think it works because each feature has same impact to “target”.  Some features must have more impact than others. So let us introduce “weight” of each feature.   For example  (-0.2)*30+0.3 *3+6,  the answer is 0.9.  “-0.2” and “0.3” are the weight for each feature respectively. “6” is a kind of adjustment. This time it looks better as “age” has a different impact from “the number of travels”against “target”.  So “target”, which means in this case Susume will buy or not,  is expressed with features, “age” and  “the number of travels”.  Once it is done, we do not need to calculate by ourselves anymore as computers can do that instead of us. All we have to know is “target” can be expressed with “features”.  Maybe I can write this way : “target” ← “features”.   That is all!


Even if the number of features is more than 1000, we can do the same thing as above.  First, put the weight to each feature, second, sum up all features with each weight.  Therefore, you understand how a lot of data can be converted to  just “one value”.  With one value, we can easily judge whether Susumu is likely to buy or not.  The higher value he has,  the more likely he will buy clothes. It is very useful because it enables us to intuitively know whether customers will buy or not.

Next week I would like to introduce “Logistic regression model” and explain how it can be classified quantitatively.   See you next week!

Is this message spoken by human or machine?!

binary-system-557614_1280

Firstly, could you watch the video ?   Our senior instructor speaks about himself.  It sounds natural for me,  far better than my poor English. Then the question comes. Who speaks in reality?  Human or machine?  The answer is IBM Watson,  one of the famous artificial intelligence in the world.  When I listened to his (or her?) English, I was very surprised as it sounds very natural and fluent.  I want to have artificial English speakers for a long time in order to develop self speaking apps. Finally, I found it!

This function is one of the new five services provided in IBM Watson Developer Cloud as beta service.   Now it has 13 functions total. Here are new services.

  1. Speech to Text :  Speech can be converted to text in real-time basis. It looks good when I try to convert news broadcast into text.
  2. Text to Speech :  This is used to prepare the video message above without native speakers. It sounds natural for both male and female voices.  English and Spanish (only male) are currently available. One of them is the American English voice used by Watson in the 2011 Jeopardy match
  3. Visual Recognition : When you can input jpg image, Watson can identify what it is with probabilities.  I try several images, however it looks less accurate than I expected so far. In my view it needs improvement to be used in applications.
  4. Concept Insights : According to explanations in the company blog, the Concept Insights service links documents that you provide with a pre-existing graph of concepts based on Wikipedia.   I think it is useful as it works beyond just using keywords in searching information.
  5. Tradeoff Analytics : According to explanations in the company blog, it helps people make better choices when faced with conflicting goals and multiple alternatives, each with its own strengths and weaknesses.  I think it has optimization algorithms in it. It may be useful to construct investment portfolios.

Watson can listen to speeches,  read text and speak it.  It also can see the image and understand what is to some extent. Therefore Watson can do the same thing as human do with new added functions.  Therefore, in theory,  mobile applications can obtain the same functions as people do, such as seeing, reading, listening and speaking.

IBM Watson Developer Cloud has a plan to add new functions as they are ready. Although they are currently beta service,  its quality must be improved gradually as machine learning behind services learns a lot in future. It enables us to develop new services with artificial intelligence to be available in a short period.  It must be amazing. What kind of services do you want? Maybe it will be available in near future !

Note:IBM, IBM Watson, the IBM logo are trademarks of International Business Machines Corporation, registered in many jurisdictions worldwide. 

Mobile and Machine learning can be good friends in 2015 !

smartphone-584701_1280


Number of mobile devices will be increasing drastically in the emerging markets in 2015. One of the biggest reason why it is increasing is that good smart phones are affordable because of competitions among the suppliers such as Google, Samsun and Xiaomi.  It is good for people in the emerging countries because a lot of people can have their own personal devices and enjoy the same internet life as people in developed countries do. I hope everyone all over the world will be able to be connected to the internet in near future.

Not only the number of mobile devices but the quality of its services will be changed dramatically in 2015 because machine learning will be available for commercial purpose. Let us consider this change more details. The key idea behind this is “Shift from judgement by ourselves to judgement by machines”.


1.  Machine Learning

Machine Learning has a power to change every industry. With machine learning,  computers can identify certain objects in images and video,  understand conversations with us and read the documents written in natural languages.  It means that most of information around us can be interpreted by computers.  Not only numerical data but also other kinds of information are understood by computers.  This changes landscape of every industry completely.  Computers can make business decisions and all we have to do is just to monitor it.  It already happened in the field of assessing credit worthiness of the customers  in banks many years ago.  Same things will happen in all industries near future.


2. Data

In emerging markets, more and more mobile phones will be sold so that every person might own his or her device in near future. It means that people all over the world will be connected through the internet and more information are collected in real-time basis.  In addition to that a lot of automobiles, homes and parts are also connected through the internet and send the information in real-time basis, too.  Therefore we can realize when and where they are and what condition of each is in real-time basis.  So maintenance for parts will be done as soon as it is needed and optimizations of resources used by people can be achieved as we can get such information in real-time basis.


3. Output

Output from computers will be sent to mobile devices of each responsible personnel  in real-time basis. So there is no need to stay in office during working-time as we can be notified wherever we are. It raises productivity of our jobs a lot. No need to wait for notifications of outputs from computers in office anymore.


Yes, my company is highly interested in the progress of machine learning for the commercial purpose. I would like to watch it closely.  I also would like to develop new services based on machine learning on mobile devices going forward.

What is a utility function in recommender systems?

shirts-428600_1280

Let us go back to recommender systems as I did not mention last week.   Last month I found that customers’ preference and items features are key to provide recommendations. Then I started developing the model used in recommender systems.  Now I think I should explain the initial problem setting in recommender systems.  This week I looked at “Mining Massive datasets” in Coursera and I found that problem setting of recommender systems in this course is simple and easy to understand.  So I decided to follow this. If you are interested in this more detail,  I recommend to look at this course, excellent MOOCs in Coursera.


Let us introduce a utility function, which tells us how customers are satisfied with the items. The term of “utility function ” is coming from micro economics. So some of you may learn it before.  I think it is good to use a utility function here because we can use the method of economics when we analyze the impacts of recommender systems to our society going forward.  I hope  more people, who are not data-scientists, are getting interested in recommender systems.

The utility function is expressed as follows

U*x→R

U:utility of customers,  θ:customers’preferences,  x:Item features,  R:ratings of the items for the customers

This is simple and easy to understand what utility function is.  I would like to use this definition going forward. I think ratings may be one, two, three…, or it may be a continuous number according to recommender systems.

When we look at the simple models, such as linear regression model and logistic regression model,  Key metrics are explanatory variables or features and its weight or parameters. It is represented as x and θ respectively.  And product of θx shows us how much it has an impact on variables, which we want to predict. Therefore I would like to introduce θx as a critical part of my recommender engine.   ”θx” means that each x is multiplied to it’s correspondent weight θ and summing up all products .This is critically important for recommender systems. Mathematically θx is calculations of products of vectors/matrices. It is simple but has a strong power to provide recommendations effectively. I would like to develop my recommender engine by using θx next week.


Yes, we should consider what color of shirts maximize our utility functions, for example.  In futures, utility functions of every person might be stored in computers and recommendations might be provided automatically in order to maximize our utility functions. So everyone may be satisfied with everyday life. What a wonderful world it is!

How can we predict the price of wine by data analysis ?

restaurant-386820

Before discussing the models in details,  It is good to explain how models work in general, so that beginners for data analysis can understand models. I select one of the famous research of wine quality and price by  Orley Ashenfelter , a professor of economics at Princeton university. You can look at the details of the analysis on this site. This is “BORDEAUX WINE VINTAGE QUALITY AND THE WEATHER”. I calculated them by myself in order to explain how models work in data analysis.


1. Gathering data

Quality and price of wine are closely related to the quality of the grapes.  So it is worth considering what factors impact the quality of the grapes.  For example, Temperatures, quantities of rain, the skill of the farmers, the quality of vineyards may be candidates of the factors. Historical data of each factor for more than 40 years are needed in this analysis. It is sometimes very important in practice, whether data is available for longer periods. Here is the data used in this analysis.  So you can do it by yourself  if you want to.


2.  Put data into models

Once data is prepared, I input the data into my model in R. This time, I use linear regression model, which is  one of the simplest models.  This model can be expressed by the products of explanatory variables and parameters. According to the web sites,  explanatory variable as follows

       WRAIN      1  Winter (Oct.-March) Rain  ML                
       DEGREES    1  Average Temperature (Deg Cent.) April-Sept.   
       HRAIN      1  Harvest (August and Sept.) ML               
       TIME_SV    1  Time since Vintage (Years)

This is RStudio, famous Integrated Development Environment for R.   Upper left side of RStudio, I developed the function with linear regression “lm” with R and data from the web site is input into the model.

スクリーンショット 2014-09-30 14.05.37


3. Examine the outputs from models

In order to predict wine price,  parameters should be obtained firstly.  There is no need to worry about.  R can calculate this automatically. The result is as follows. Coefficients mean parameters here. You can see this result in lower left side of RStudio.

Coefficients:

(Intercept)     WRAIN    DEGREES   HRAIN    TIME_SV
-12.145007   0.001167   0.616365   -0.003861   0.023850

Finally, we can predict wine price. You can see the predictions of wine price in lower right side of RStuido.

Rplot

This graph shows the comparison between the predictions of wine price and real price of wine.  Red square tells us predictions of price and Blue circle tells real price. These are relative prices against an average price in 1961.  So the real price in 1961 is 1.0.  It seems that the model works well.  Of course it may not work now as it was made more than 20 years ago. But it is good to learn how models work and predictions are made by this research. Once you can understand the linear regression model, it enables you to understand other complex models with ease. I hope you can enjoy prediction of wine price. OK, let us move on recommender engines again next week !


Notice: TOSHI STATS SDN. BHD. and I do not accept any responsibility or liability for loss or damage occasioned to any person or property through using materials, instructions, methods, algorithm or ideas contained herein, or acting or refraining from acting as a result of such use. TOSHI STATS SDN. BHD. and I expressly disclaim all implied warranties, including merchantability or fitness for any particular purpose. There will be no duty on TOSHI STATS SDN. BHD. and me to correct any errors or defects in the codes and the software.

Credit Risk Management and Machine Learning in future

macbook-336704_640

Credit risk is always s hot topic in economic news.   Are US Treasury bonds safe? Does the Chinese banking system have problems?   Is the ratio of household debt to GDP is high in Malaysia?  etc. When we think about credit risk, it is critically important to know how we measure credit risk. So I would like to reconsider how we can apply Machine learning to credit risk management in financial institutions.  When I used to be a credit risk manager in a Japanese consumer finance company 10 years ago,  there were no cloud service and no social media. However, now that it is the time of big data,  it is a good timing to reconsider how we can manage credit risk by using the latest technologies such as cloud services and Machine learning. Let me take three points as follows.


1. Statistical models

One of the key metrics in credit risk management is the probability of  defaults (PD).  It is usually calculated from statistical models such as regression analysis.  Machine learning has algorithms about regression analysis, therefore it must  be easy to implement Machine learning to credit risk management systems in financial intuitions. Once PD is calculated from Machine learning,  this figure can be used the same way as current practices in financial institutions.  Statistical models usually have versions since it is developed but there is no need to worry about version control because it is easy on the cloud system.


2. Data

Data is more different from one which used to be 10 years ago.   I used private and closed data only in order to calculate the risk for each borrower.  Now that social media data and open public data are available in risk management,  we need to consider how to use these kind of data in practice. For this purpose,  cloud services are good because they are scalable and easy to expand the capacity to store data whenever it is needed.


3.  Product development

Recently product development is fast and active to keep the competitive edge as customer can choose channels, to contact with financial institutions and are getting more demanding.  That is why risk management in financial institutions should be flexible to update product portfolio and adjust methods in the light of  characteristics of new products.  Combination of cloud service and machine learning enable us to develop the risk models, enough to quick to keep up with new products and change of business environments.


Unlike retail industries,  financial industries are heavily regulated and required to audit risk management systems periodically. Therefore, audit trails are also important when Machine learning is applied to credit risk management.  I think combination cloud services and machine learning is good to enhance credit risk management with cost-effectiveness  in the long run. I would like to try this combination in credit risk management  if I can do it.

Challenge to Machine Learning

home-office-336373_640

Machine Learning is getting famous and attractive to analyze big data.  It has a long history to be developed as the algorithm since 1950s.  However machine learning gets a spotlight among data scientist recently because  a lot of data,  computer resources and data storage, which are necessary for machine learning, has been available with reasonable costs.    I would like to introduce a basic algorithm of Machine Learning by using R language,  which I recommended before.

1.  Problem sets

Observed data x= [1,2,3] and y= [5,7,9].  Then I would like to find what are a and b when I assume that it can be expressed  y=ax+b.  Yes, it is obvious that a=2 and b=3, however, I want this solution by using algorithms to calculate them.


2. Algorithm

This is my program of machine learning to find what  a and b are.  I would like to focus on Bold part of the program.

First step      :       update parameters

Second step :       calculate the updated value of the cost function by the updated parameters

Third step    :       compare the updated value with the old value of the cost function and stop calculation if it is considered as convergence

Go back to the first step above.

These three steps above are generally used in machine learning algorithms. So it is useful if you can remember them.


ML<-function(le){

x=matrix(c(1,1,1,1,2,3),3,2)
y=matrix(c(5, 7, 9),3,1)
t=matrix(1,2,1)
m=length(y)
h=x%*%t
j=1/(2*m)*(t(h-y)%*%(h-y))

for (i in seq(1,1000)){
h=x%*%t
tnew=t-le/m*t(x)%*%(h-y)
hnew=x%*%tnew
jnew=1/(2*m)*(t(hnew-y)%*%(hnew-y))
if (abs(jnew-j)<=10^(-8)) break
t=tnew
j=jnew
print(i)
print(t)
end
}
}


3.  The result of calculation

I use  le=0.1 as a learning rate.  Then I get the result of the calculation below.

[1] 521

[,1]
[1,] 2.997600
[2,] 2.001056

This means that the value of the cost function is convergent at 521 time calculations.  a = 2.001056 and b =  2.997600.    They are very close to true values a=2 and b=3.  So it is considered that this algorithm can find the solutions.


This algorithm is one of the most simple ones. However, it includes the fundamental structure which can be applied to other complex algorithms.  So I recommend you to implement this by yourself and be familiar with this kind of algorithms.  In short, 1. Update parameters  2. Calculate the updated value of cost function  3. Make sure updated value is convergent.   Yes, it is so simple!

TOSHI STATS SDN. BHD. and I do not accept any responsibility or liability for loss or damage occasioned to any person or property through using algorithms, instructions, methods or ideas contained herein, or acting or refraining from acting as a result of such use. TOSHI STATS SDN. BHD. and I expressly disclaim all implied warranties, including merchantability or fitness for any particular purpose. There will be no duty on TOSHI STATS SDN. BHD. and me to correct any errors or defects in the codes and the software.

Let us go surfing the sea of big data !

In the morning, I check my smart phone and i pad mini to see what happened during the night.  Every time I touch them, data is generated automatically.  How many devices such as smart phones and tablets are there in the world?  I am sure a lot of data is generated at this moment.

It is also noted that FRB, World Bank, IMF and other public institutions make their data available to public through their web sites. In addition, a lot of public data is getting easier to access thanks to the data gathering services. Data is the first key thing to consider when we start data analytics. Therefore, it is very important to know what kind of data is available at your disposal in analyzing data.

I have been using a data gathering service called “Quandl”. Quandl is a “data platform“, which enable us to collect numerical data published by hundreds of different sources, and host them on a single easy-to-use website.  Currently it can be used for free. Once I obtain the data, I visualize it in order to understand what it means and what the mechanism is  behind the data.  I use ” DataHero” to visualize the data I obtain.  It is easy to produce many kinds of charts and graphs. By “DataHero”, I can produce a lot of graphs by following its instructions, then choose the best one to present what I want to say.  It can be used for basic functionality without any fee. If you pay fees, you can get more functionality such as a tool to combine multiple datasets.  


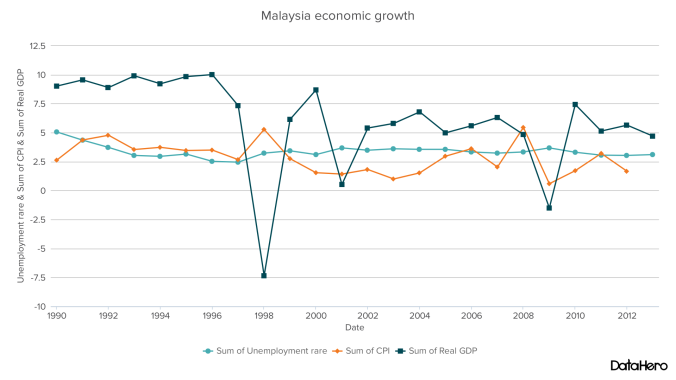
According to the sun newspaper on May 20 2014, Mr Najib Abdul Razak, prime minister of Malaysia, said that the 6.2% of GDP growth in the first quarter of this year as extremely outstanding.  This is the highest among the list he presented in his Facebook site.  Let us see what is going on from the past to the present in terms of economic growth of Malaysia. I pick up the data of Real GDP growth rate,  Unemployment rate and Consumer price index (CPI) since 1990 in Malaysia by using  Quandl and visualize these data by using DataHero. It is very easy and takes less than 5 minutes if you are getting familiar with these systems.    Source : Open Data for Africa (IMF)

DataHero Malaysia economic growth

This graph tells us economic growth in Malaysia since 1990.  The growth rate is over 5%, except two economic crisis in 1998, 2009 and 2001.  The unemployment rate has been around 3%, which is good for the economy.  CPI is also around 3% and stable. I can say economic growth without inflation currently is achieved in Malaysia.

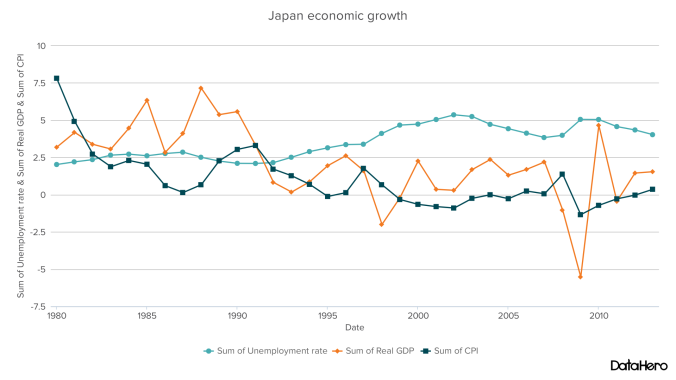
I would like to compare it to the situation in Japan since 1980.  Let us see the graph below.

DataHero Japan economic growth

GDP growth peaked out in the late of the 1980s, when the bubble economy was peaked.   Since 1990, when the bubble burst,  Japan has experienced the low economic growth.  CPI has been very low and sometimes went to negative as Japan has been in deflation.  The unemployment rate has been gradually increasing and  peaked over 5%. This period is called “the lost two decades” as Japan has poor economic performances. It is not easy to explain why it happened in Japan.  Some economists blamed monetary policy was not so effective enough to recover its economy.  Others criticized the fiscal stimulate was too late, too small and too short. I would like to analyze the mechanism of ” lost two decades” going forward in this blog.


Do you want to be “Analytic savvy manager”?

Data is and will be around us and it is increasing at an astonishing rate.  In the such business environment,  what should business managers do?    I do no think every manager should have an analytics skill at the same level as a data scientist because it is almost impossible.  However, I do think every manager should communicate with data scientists and make better decisions by using output from their data analysis.  Sometimes this kind of manager is called “analytic savvy manager”.  Let us consider what “analytic savvy manager”should know.


1.   What kind of data is available to us?

Business managers should know what kind of data is available for their business analysis.  Some of them are free and others are not.  Some of them are in  companies or private and others are public.  Some of them are structured and others are not.  It is noted that data which are available is increasing in terms of volume and variety.  Data is a starting point of analysis, however, data scientists may not know specific fields of business in detail. It is business managers that know what data is available to businesses.  Recently data gathering services have provided us a lot of data for free.  I recommend you to look at “Quandl” to find public data. It is easy to use and provides a lot of public data for free.  Strong recommendation!


2.  What kind of analysis method can be applied?

Business managers do not need to memorize formulas of each analysis method.  I recommend business managers to understand simple linear regression and logistic regression and get the big picture about how the statistical models work. Once you are familiar with two methods,  you can understand other complex statistical models with ease because fundamental structures are not so different among methods.  Statistical models enable us to understand what big data means without loss of information.  In addition to that,  I also recommend business managers to keep in touch with the progress of machine learning,  especially deep learning.  This method has great performances and is expected to be used in a lot of business field such as natural language processing.  It may change the landscape of businesses going forward.


3.  How can output from analysis be used to make better decisions?

This is critically important to make a better decision.  Output of data analysis should be in aligned with business needs to make decisions.  Data scientist can guarantee whether numbers of the output are accurate in terms of calculations. However, they can not guarantee whether it is relevant and useful to make better decisions.  Therefore business managers should communicate with data scientist during the process of data analysis and make the output of analysis relevant to business decisions. It is the goal of data analysis.


I do not think these points above are difficult to understand for business managers even though they do not have a quantitative analytic background.   If you are getting familiar with these points above, it would make you different from others at the age of big data.

Do you want to be “Analytic savvy manager”?

13943376615435