“DEEP LEARNING PROJECT for Digital marketing” starts today. I present probability of visiting the store here

cake-623579_640

At the beginning of this year,  I set up a new project of my company.  The project is called “Deep Learning project” because “Deep Learning” is used as a core calculation engine in the project. Now that I have set up the predictive system to predict customer response to a direct mailing campaign, I would like to start a sub-project called  “DEEP LEARNING PROJECT for Digital marketing”.  I think the results from the project can be applied across industries, such as healthcare, financial, retails, travels and hotels, food and beverage, entertainments and so on. First, I would like to explain how to obtain probability for each customer to visit the store in our project.


1. What is the progress of the project so far?

There are several progresses in the project.

  • Developing the model to obtain the probability of visiting the store
  • Developing the scoring process to assign the probability to each customer
  • Implement the predictive system by using Excel as an interface

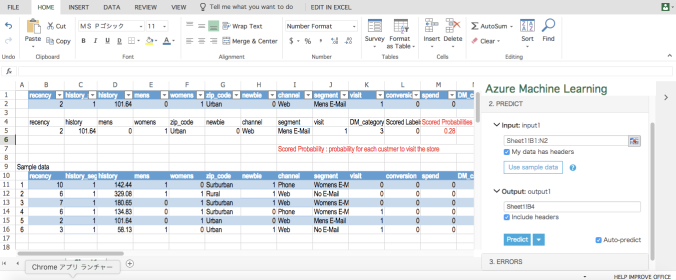
Let me explain our predictive system. We constructed the predictive system on the platform of  Microsoft Azure Machine Learning Studio. The beauty of the platform is Excel, which is used by everyone, can be used as an interface to input and output data. This is our interface of the predictive system with on-line Excel. Logistic regression in MS Azure Machine Learning is used as our predictive model.

The second row (highlighted) is the window to input customer data.

Azure ML 1

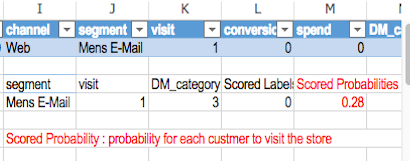
Once customer data are input, the probability for the customer to visit the store can be output. (See the red characters and number below). In this case (Sample data No.1) the customer is less likely to visit the store as Scored  Probabilities is very low (0.06)

Azure ML 3


On the other hand,  In the case (Sample data No.5) the customer is likely to visit the store as Scored Probabilities is relatively high (0.28). If you want to know how it works, could you see the video?

Azure ML 2

Azure ML 4


2. What is the next in our project?

Once we create the model and implement the predictive system, we are going to the next stage to reach more advanced topics

  • More marketing cases with variety of data
  • More accuracy by using many models including Deep Learning
  • How to implement data-driven management


Our predictive system should be more flexible and accurate. In order to achieve that, we will perform many experiments going forward.


3. What data is used in the project?

There are several data to be used for digital marketing. I would like to use this data for our project.

When we are satisfied with the results of our predictions by this data,  next data can be used for our project.


Digital marketing is getting more important to many industries from retail to financial.   I will update the article about our project on a monthly basis. Why don’t you join us and enjoy it!  When you have your comments or opinions, please do not hesitate to send us!

If you want to receive update of the project or want to know the predictive system more, could you sing up here?


Microsoft, Excel and AZURE are either registered trademarks or trademarks of Microsoft Corporation in the United States and/or other countries.

Notice: TOSHI STATS SDN. BHD. and I do not accept any responsibility or liability for loss or damage occasioned to any person or property through using materials, instructions, methods, algorithm or ideas contained herein, or acting or refraining from acting as a result of such use. TOSHI STATS SDN. BHD. and I expressly disclaim all implied warranties, including merchantability or fitness for any particular purpose. There will be no duty on TOSHI STATS SDN. BHD. and me to correct any errors or defects in the codes and the software.

This is No.1 open-online course of “Deep Learning”. It is a new year present from Google!

desk-918425_640

I am very happy to find this awesome course of “Deep Learning” now . It is the course which is provided by Google through Udacity(1), one of the biggest mooc platforms in the world. So I would like to share it to any person who are interested in “Deep Learning”.

It is the first course which explains Deep Learning from Logistic regression to Recurrent neural net (RNN) in the uniformed manner on mooc platform as far as I know. I looked at it and was very surprised how awesome the quality of the course is.  Let me explain more details.


1. We can learn everything from Logistic regression to RNN seamlessly

This course covers many important topics such as logistic regression, neural network,  regularization, dropout, convolutional net, RNN and Long short term memory (LSTM). These topics are seen in some articles independently before. It is however very rare to explain each of them at once in the same place.  This course looks like a story of development of Deep Learning. Therefore, even beginners of Deep Learning can follow the course. Please look at the path of the course. It is taken from the course video of L1 Machine Learning to Deep Learning .

DL path

Especially, explanations of RNN are very easy to understand. So if you do not have enough time to take a whole course, I just recommend to watch the videos of RNN and related topics in the course. I am sure it is worth doing that.


2. Math is a little required, but it is not an obstacle to take this course

This is one of the courses in computer science.  The more you understand math, the more you can obtain insights from the course. However, if you are not so familiar with mathematics, all you have to do is to overview basic knowledge of “vectors”, “matrices” and “derivatives”.  I do not think you need to give up the course because of the lack of knowledge of math. Just recall high school math, then you can start this awesome course!


3. “Deep learning” can be implemented with “TensorFlow“, which is open source provided by Google

This is the most exciting part of the course if you are developers or programmers.  TensorFlow is a  python-based language. So many developers and programmers can be familiar with TensorFlow easily.  In the program assignments, participants can learn from simple neural net to sequence to sequence net with TensorFlow. It must be good! While I have not tried TensorFlow programming yet, I would like to do that in the near future. It is worth doing that even though you are not programmers. Let us challenge it!


In my view,  Deep Learning for sequence data is getting more important as time series data are frequently used in economic analysis,  customer management and internet of things.   Therefore, not only data-scientists, but also business personnel, company executives can benefit from this course.  It is free and self-paced when you watch the videos. If you need a credential, small fee is required. Why don’t you try  this awesome course?


(1) Deep Learning on Udacity

https://www.udacity.com//course/viewer#!/c-ud730/l-6370362152/m-6379811815


Notice: TOSHI STATS SDN. BHD. and I do not accept any responsibility or liability for loss or damage occasioned to any person or property through using materials, instructions, methods, algorithm or ideas contained herein, or acting or refraining from acting as a result of such use. TOSHI STATS SDN. BHD. and I expressly disclaim all implied warranties, including merchantability or fitness for any particular purpose. There will be no duty on TOSHI STATS SDN. BHD. and me to correct any errors or defects in the codes and the software.


Now I challenge the competition of data analysis. Could you join with us?

public-domain-images-free-stock-photos-high-quality-resolution-downloads-nashville-tennessee-21

Hi friends.  I am Toshi.  Today I update the weekly letter.  This week’s topic is about my challenge.  Last Saturday and Sunday I challenged the competition of data analysis in the platform called “Kaggle“. Have you heard of that?   Let us find out what the platform is and how good it is for us.


This is the welcome page of Kaggle. We can participate in many challenges without any fee.  In some competitions,  the prize is awarded to a winner. First, data are provided to be analyzed after registration of competitions.  Based on the data, we should create our models to predict unknown results. Once you submit the result of your predictions,  Kaggle returns your score and ranking in all participants.

K1

In the competition I participated in, I should predict what kind of news articles will be popular in the future.  So “target” is “popular” or “not popular”. You may already know it is “classification” problem because “target” is “do” or “not do”  type. So I decided to use “logistic curve” to predict, which I explained before.  I always use “R” as a tool for data analysis.

This is the first try of my challenge,  I created a very simple model with only one “feature”. The performance is just average.  I should improve my model to predict the results more correctly.

K3

Then I modified some data from characters to factors and added more features to be input.  Then I could improve performance significantly. The score is getting better from 0.69608  to 0.89563.

In the final assessment, the data for predictions are different from the data used in interim assessments. My final score was 0.85157. Unfortunately, I could not reach 0.9.  I should have tried other methods of classification, such as random forest in order to improve the score. But anyway this is like a game as every time I submit the result,  I can obtain the score. It is very exciting when the score is getting improved!

K4


This list of competitions below is for the beginners. Everyone can challenge the problems below after you sign off.  I like “Titanic”. In this challenge we should predict who could survive in the disaster.  Can we know who is likely to survive based on data, such as where customers stayed in the ship?  This is also “classification”problem. Because the “target” is “survive”or “not survive”.

K2


You may not be interested in data-scientists itself. But it is worth challenging these competitions for everyone because most of business managers have opportunities to discuss data analysis with data-scientists in the digital economy. If you know how data is analyzed in advance, you can communicate with data-scientists smoothly and effectively. It enables us to obtain what we want from data in order to make better business decisions.  With this challenge I could learn a lot. Now it’s your turn!

Do you want to know “how banks rate you when you borrow money from banks”?

singapore-218528_1280

Hi friends,  I am Toshi, This is my weekly letter. This week’s topic is “how banks rate you when you borrow money from banks”. When we want bank loans, it is good that we can borrow the amount of money we need,  with a lower interest.  Then I am wondering how banks decide who can borrow the amount of money requested with lower interests. In other words, how banks assess customer’s credit worthiness.  The answer is “Classification”.  Let me explain more details. To make the story simple,  I take an example of  unsecured loans, loans without collateral.


1.  “Credit risk model” makes judgements to lend

Now many banks prepare their own risk models to assess credit worthiness of customers.  Especially global banks are required to prepare the models by regulators, such as BIS, FSA and central banks. Major regional banks are also promoted to have risk models to assess credit worthiness.  Regulations may differ from countries to countries,  by size of banks.  But it is generally said that banks should have their risk models to enhance credit risk management.  When I used to be a credit risk manager of the Japanese consumer finance company, which is one of  the group companies in the biggest financial group in Japan,  each customer is rated by credit risk models. Good rating means you can borrow money with lower interest. On the other hand, bad rating means you can borrow only limited amount of money with higher interest rate or may be rejected to borrow. From the standpoint of management of banks, it is good because banks can keep consistency of the lending judgements to customers among the all branches.  The less human judgement exists, the more consistency banks keep.  Even though business models may be different according to strategies of banks, the basic idea of the assessment of credit worthiness is the same.


2. “Loan application form” is a starting point of the rating process

So you understand credit risk models play an important role. Next, you may wonder how rating of each customer is provided.  Here “classification” works. Let me explain about this.  When we try to borrow money,  It is required to fill “application forms”. Even though the details of forms are different according to banks,  we are usually asked to fill “age” “job title” “industry” “company name” “annual income” “owned assets and liabilities” and so on.   These data are input into risk models as “features”.   So each customer has a different value of “features”.  For example, someone’s income is high while others income is low.   Then I can say  “Features”of each customer can explain credit worthiness of each customer.   In other words,  credit risk model can “classify”  customers with high credit worthiness and customers with low credit worthiness by using  “features”.


3.  Rating of each customer are provided based on “probability of default

Then let us see how models can classify customers in more details. Each customer has values of “features”  in the application form. Based on the values of “features”, each customer obtains his/her own “one value”.  For example, Tom obtains “-4.9” and Susum obtains “0.9” by adding “features” multiplied with “its weight”.  Then we can obtain “probability of default” for each customer.  “Probability of default” means the likelihood where the customer will be in default in certain period, such as one year. Let us see Tom’s case. According to the graph below,  Tom’s probability of default, which is shown in y-axis, is close to 0.  Tom has a low “probability of default”. It means that he is less likely to be in default in the near term. In such a case,  banks provide a good rating to Tom. This curve below is called “logistic curve” which I explained last week. Please look at my week letter on 23 April.

logistic2

Let us see Susumu’s case. According to the graph below,  Susumu’s probability of default, which is shown in y-axis, is around 0.7, 70%.  Susumu has a high probability of default. It means that he is likely to be in default in the near term. In such a case,  banks provide a bad rating to Susumu. In summary,  the lower probability of default is,  the better rating is provided to customers.


logistic1

Although there are other methods  of “classification”,  logistic curve is widely used in the financial industry as far as I know. In theory, the probability of default can be obtained for many customers from individuals to big company and sovereigns, such as “Greeks”.  In practice, however, more data are available in loans to individuals and small and medium size enterprises (SME) than loans to big companies.  The more data are available, the more accurately banks can assess credit worthiness. If there are few data about defaults of customers in the past,  it is difficult to develop credit risk models effectively. Therefore, risk models of individuals and SMEs might be easier than risk models of big companies as more data are usually available in loans to individuals and SMEs.

I hope you can understand the process to rate customers in banks. Data can explain our credit worthiness, maybe better than we do. Data about us is very important when we try to borrow money from banks.

The reason why computers may replace experts in many fields. View from “feature” generation.

public-domain-images-free-stock-photos-aureliejouan-lights

Hi friends, I am Toshi. I updated my weekly letter.  Today I explain 1. How classification, do or do not, can be obtained with probabilities and 2. Why computers may replace experts in many fields from legal service to retail marketing.   These two things are closely related to each other. Let us start now.


1.  How can classification be obtained with probabilities?

Last week, I explained that “target” is very important and “target” is expressed by “features”.  For example Customer “buy” or “not buy” may be expressed by customers age and  the number of  overseas trips a year.  So I can write this way : “target” ← “features”.   This week, I try to show you the value of “target” can be a probability, which is  a number between 0 and 1.  If the “target” is closer to “1”,  the customer is highly likely to buy.   If the target is closer to “0”,  the customer is less likely to buy.   Here is our example of “target” and “features” in the table below.

customer data

I want  Susumu’s value of the “target” to be close to “1” in calculations by using “features”.  How can we do that?   Last week we added “features” with“weight” of each feature.   For example  (-0.2)*30+0.3 *3+6,  the answer is 0.9.  “-0.2″ and “0.3” are the weight for each feature respectively. “6” is a kind of adjustment.  Next let us introduce this curve below. In the case of Susumu, his value from his features is 0.9. So let us put 0.9 on the x-axis, then what is the value of y? According to this  curve, the value of y is around 0.7. It means that  Susumu’s probability of buying products is around 0.7.  If probability is over 0.5, it is generally considered that customer is likely to buy.

logistic1

In the case of Tom, I want his value of the “target” to be close to “0” in calculations by using “features”.  Let us add his value of features as follows  (-0.2) *56+0. 3 *1+6,  the answer is -4.9.  His value from his features is -4.9. So let us put  -4.9 on the x-axis, then what is the value of y?  According to this curve, Tom’s probability of buying products is almost 0. Unlike Susumu’s case, Tom is less likely to buy.

logistic2

This curve is called “logistic curve“.   It is interesting that whatever value “x” takes, “y” is always between 0 and 1.  By using this curve, everyone can have the value between 0 and 1, which is considered as the probability of the event. This curve is so simple and useful that it is used in many fields.  In short, everyone has a probability of buying products, which is expressed as the value of “y”.  It means that we can predict who is likely to buy in advance as long as “features”are obtained! The higher value customers have, the more likely they will buy the products.


2.  Why may computers replace experts in many fields?

Now you understand what are”features”.  “Features” generally are set up based on expert opinion. For example, if you want to know who is in default in the future, “features”needed are considered “annual income”, “age”, “job”, “the past delinquency” and so on. I know them because I used to be a credit risk manager in consumer finance company in Japan.  Each expert can introduce the features in the business and industries.  That is why the expert’s opinion is valuable, so far. However, computers are also creating their features based on data. They are sometimes so complex that no one can understand them. For example, ” -age*3-number of jobs in the past” has no meaning for us. No one knows what it means. But computers do. Sometimes computers can predict “target”, which means “do” or “not do” with their own features more precisely than we do.


In the future,  I am sure much more data will be available to us.  It means computers have more chance to create better “features” than experts do. So experts should use the results of predictions by computers and introduce them into their insight and decisions in each field.  Otherwise, we cannot compete with computers because computers can work 24 hours/day and 365 days/year. It is very important that the results of predictions should be used effectively to enhance our own expertise in future.


Notice: TOSHI STATS SDN. BHD. and I, author of the blog,  do not accept any responsibility or liability for loss or damage occasioned to any person or property through using materials, instructions, methods, algorithm or ideas contained herein, or acting or refraining from acting as a result of such use. TOSHI STATS SDN. BHD. and I expressly disclaim all implied warranties, including merchantability or fitness for any particular purpose. There will be no duty on TOSHI STATS SDN. BHD. and me to correct any errors or defects in the codes and the software.

Easy way to understand how classification works without formula! no.1

public-domain-images-free-stock-photos-high-quality-resolution-downloads-around-the-house-18

Hello, I am Toshi. Hope you are doing well. Last week  I introduced “classification” to you and explained it can be applied to every industry. Today I would like to explain how it works step by step  this week and next week. Do not worry, no complex formula is used today.  It is easier than making pancakes with fry pan!

I understand each business manager have different of problems and questions. For example, if you are a sales manager in retail, you would like to know who is likely to buy your products.  If you are working in banks, you want to know who will be in default. If you are in the healthcare industries, who is likely to have diseases in future.  It is awesome for your business if we can predict what happens with certainty in advance.

These problems look like different from each other. However, they are categorized as same task called “classification” because we need to classify “do” or “do not”.  For sales managers, it means that “buy” or “not buy”. For managers in banks,  “in default” or “not in default”. In personnel in legal service, “win the case” or “not win the case”.  If predictions about “do” or “do not” can be obtained in advance.  It can contribute to the performance  of your businesses. Let us see how it is possible.


1.  “target” is significantly important

We can apply “do” or ” do not” method to all industries. Therefore, you can apply it to your own problems in businesses.  I  am sure you are already interested in  your own “do” or ” do not”.   Then let us move on to data analysis.  “Do” or “do not” is called “target” and has a value of  “1” or “0”.  For example, I bought premium products in a retail shop,  In such a case,  I have “1” as  a target.  On the other hand, my friend did not buy anything there.  So she has “0”  as a target.   Therefore  everyone should have “1” or “0” as a target.   It is very important as a starting point.  I recommend to consider what is a good  “target” in your businesses.


2.  What are closely related to “target”?

This is your role because you have expertise in your business.  It is assumed that you are sales manager of retail fashion. Let us imagine what are closely related to the customer’s “buy” or “not buy”.  One of them may be customers’ age because younger generation may buy more clothes than senior.  Secondly, the number of  overseas trips a year because the more they travel overseas, the more clothes they buy.  Susumu, one of my friends, is 30 years old and travels overseas three times a year.  So his data is just like this : Susumu  (30, 3).  These are called “features”.   Yes, everyone has different values of the features. Could you make your own values of features by yourself?  Your value of the features must be different from (30,3).  Then, with this feature (30, 3),  I would like to express “target” next.  (NOTE: In general,  the number of features is far more than two. I want to make it simple to understand the story with ease.)  Here is our customer data.

customer data

3.  How “targets” can be expressed with “features”?

Susumu has his value of features (30, 3).  Then let us make the sum of  30 and 3. The answer is 33.  However, I do not think it works because each feature has same impact to “target”.  Some features must have more impact than others. So let us introduce “weight” of each feature.   For example  (-0.2)*30+0.3 *3+6,  the answer is 0.9.  “-0.2” and “0.3” are the weight for each feature respectively. “6” is a kind of adjustment. This time it looks better as “age” has a different impact from “the number of travels”against “target”.  So “target”, which means in this case Susume will buy or not,  is expressed with features, “age” and  “the number of travels”.  Once it is done, we do not need to calculate by ourselves anymore as computers can do that instead of us. All we have to know is “target” can be expressed with “features”.  Maybe I can write this way : “target” ← “features”.   That is all!


Even if the number of features is more than 1000, we can do the same thing as above.  First, put the weight to each feature, second, sum up all features with each weight.  Therefore, you understand how a lot of data can be converted to  just “one value”.  With one value, we can easily judge whether Susumu is likely to buy or not.  The higher value he has,  the more likely he will buy clothes. It is very useful because it enables us to intuitively know whether customers will buy or not.

Next week I would like to introduce “Logistic regression model” and explain how it can be classified quantitatively.   See you next week!

“Classification” is significantly useful for our business, isn’t it?

public-domain-images-free-stock-photos-high-quality-resolution-downloads-public-domain-archive-14

Hello, I am Toshi. Hope you are  doing well. Now I consider how we can apply data analysis to our daily businesses.  So I would like to introduce “classification” to you.

If you are working in marketing/sales departments, you want to know who are likely to buy your products and services. If you are in legal services, you would like to know who wins the case in a court. If you are in financial industries, you would like to know who will be in default among your loan customers.

These cases are considered as same problems as “classfication”.  It means that you can classify a thing or an event you are interested in from all populations you have on hand.  If you have data about who bought your products and services in the past, we can apply “classification” to predict who are likely to buy and make better business decisions. Based on the results of classification,  you can know who is likely to win cases and who will be in default with a numerical measure of certainty,  which is called “probability”.  Of course, “classification” can not be a fortune teller.  But “classification” can provide us who is likely to do something or what is likely to occur with some probabilities.  If your customer has 90% of probabilities based on “classification”, it means that they are highly likely to buy your products and services.


I would like to tell several examples of “classification” for each business. You may want to know the clues about the questions below.

  • For the sales/marketing personnel

What is the movie/music in the Top 10 ranking in the future?

  • For personnel in the legal services

Who wins the cases ?

  • For personnel in the financial industries or accounting firms

Who will be in default in future?

  • For personnel in healthcare industries

Who is likely to have a disease or cure diseases?

  • For personnel in asset management marketing

Who is rich enough to promote investments?

  • For personnel in sports industries

Which team wins the world series in baseball?

  • For engineers

Why was the spaceship engine exploded in the air?


We can consider a lot of  examples more as long as data is available.  When we try to solve these problems above,  we need data in the past, including the target variable, such as who bought products, who won the cases and who was default in the past.  Without data in the past, we can predict nothing. So data is critically important for “classification” to make better business decisions.   I think data is “King”.


Technically, several methods are used in classification.  Logistic regression,  Decision trees,  Support Vector Machine and Neural network and so on. I recommend to learn Logistic regression first as it is simple, easy to apply real problems and can be basic knowledge to learn more complex methods such as neural network.


I  would like to explain how classification works in the coming weeks.  Do not miss it!  See you next week!

This course is the best for beginners of data analysis. It is free, too!

shield-229112_1280

Last week, I started learning on-line course about data analysis. It is “The Analytics Edges” in edx, one of the biggest platforms of MOOCs all over the world (www.edx.org).  This course says “Through inspiring examples and stories, discover the power of data and use analytics to provide an edge to your career and your life.”   Now I completed Unit one and two out of  total nine in the course and found that it is the best course for beginners of data analysis in MOOCs. Let me tell you why it is.


1. There are a variety of data sets to analyze

When you start learning data analysis, data is very important to motivate yourself to continue to learn.  When you are sales personnel, sales data is the best to learn data analysis because you are interested in sales as professional.  When you are in financial industries, financial data is the best for you.   This course uses a variety of data from crime rate to automobile sales.  Therefore, you can see the data you are interested in. It is critically important for beginners of data analysis.


2. This course focuses on how to use analytics tools, quite than the theory behind the analysis

Many of data analysis courses take a long time to explain the theory behind the analysis.  It is required when you want to be a data scientist because theory is needed to construct an analytic method by yourself. However, most of business managers do not want to be data scientists.  All business managers need is the way to analyze data to make better business decisions. For this purpose, this course is good and well-balanced between theory and practice.  Firstly, a short summary of theory is provided, then move on to practice. Most of  the lectures focus on “how to use R for data analysis”. R is one of the famous programming languages for data analysis, which is free for everyone.  It enables beginners to use R in analyzing data step by step.


3. It covers major analytic methods of data analysis.

When you see the schedule of the course,  you find many analytic methods from linear regression to optimizations.  This course covers major methods that beginners must know.  I recommend to focus on linear regression and logistic regression when you do not have enough time to compete all units because both of method is applicable to many cases in the real world.


I think it is worth seeing only the video in Unit 1 and 2.  Interesting topics are used especially for people who like baseball. If you do not have enough time to learn R programming, it is OK to skip it. The story behind the analysis is very good and informative for beginners. So you may enjoy the videos about the story and skip videos of programming for the first time. If you try to obtain a certificate from edx, you should obtain 55% at least over the homework, competition and final exam.  For beginners, it may be difficult to complete the a whole course within limited time (three-month).  Do not worry.  I think this course can be learned again in time to come.  So first time,  please focus on Unit1 and Unit2, then a second time, try a whole course if  you can. In addition, most of edx courses including this are free for anyone.   You can enjoy anytime, anywhere as long as you have an internet access.  Could you try this course with me (www.toshistats.net) ?

IBM Watson Analytics works well for business managers !

architecture-21589_1280

IBM Watson Analytics was released at 4th Dec 2014.  This is new service where data analysis can be done with conversations and no programming is needed.  I am very interested in this service so I opened my account of IBM Watson Analytics and reviewed it for a week. I would like to make sure how this service works and whether it is good for business manager with no data analysis expertise. Here is a report for that.


I think IBM Watson Analytics is good for beginners of data analysis because it is easy to visualize data and we can do predictive analysis without programming the codes. I used the data which includes  score of exam1, exam2 and results of admission.  This data can be obtained at Exercise 2 of Machine Learning at coursera.  Here is the chart drawn by IBM Watson Analytics. In order to draw this chart, All have to do is uploading data, write or choose “what is the relationship between Exam1 and Exam2 by result”, and adjust some options in red box below. In the chart,  green point means ‘admitted’ and blue point means ‘not admitted’. Therefore it enable us to understand what the data means easily.

watson2


Let us move on prediction.  We can analyze data in details here because statistical models are running behind it.  I decided “result” is a target in this analysis.   This target is categorical as it includes only “1:admitted and 0:not admitted” so logistic regression model, which is one of the classification analysis, is chosen automatically by IBM Watson Analytics.  Here is the results of this analysis. In the red box, explanations about this analysis is presented automatically. According to the matrix about score of each exam, we can estimate probability of admission. It is good for business manager as this kind of analysis usually requires  programming with R or MATLAB, python.

watson4


In my view, logistic regression is the first model to learn classification because it is easy to understand and can be applied to a lot of fields. For example I used this model to analyze how the counter parties are likely to be in default when I worked at financial industries.  For marketing,  the target can be interpreted as buy the product or not.  For maintenance of machines,  the target can be interpreted as normal or fail. The more data are corrected, the more we can apply this classification analysis to. I hope many business managers can be familiar with logistic regression by using IBM Watson Analytics.

IBM Watson Analytics has just started now so improvements may be needed to make the service better. However, it is also true that business manager can analyze data without programming by using IBM Watson Analytics.  I would like to highly appreciate the efforts made by IBM.


Note:IBM, IBM Watson Analytics, the IBM logo are trademarks of International Business Machines Corporation, registered in many jurisdictions worldwide. 

Mobile services will be enhanced by machine learning dramatically in 2015, part 2

iphone-518101_1280

Happy new year !   At the beginning of 2015,  it is a good time to consider what will happen in the fields of machine learning and mobile services in 2015.  Followed by the blog last week,  we consider recommender systems and internet of things as well as investment technologies. I hope you can enjoy it !


3. Recommender systems

Recommender systems are widely used from big companies such as amazon.com and small and medium-sized companies.  Going forward,  as image recognition technology progresses rapidly, consumer generated data such as pictures and videos must be taken to analyze consumers behaviors and construct consumers preferences effectively.  It means that unstructured data can be taken and analyzed by machine learning in order to make recommendations more accurate. This creates a virtuous cycle. More people take pictures by smartphones and send them thorough the internet, more accurate recommendations are.  It is one of the good examples of personalization. In 2015 a lot of mobile services have functions for personalization so that everyone can be satisfied with mobile services.


4. Internet of things

This is also one of big theme of the internet.  As sensors are smaller and cheaper,  a lot of devices and equipments from smart phone to automobile have more sensors in it. These sensors are connected to the internet and send data in real-time basis.  It will change the way to maintain equipments completely.  If fuel consumption efficiency of your car is getting worse, it may be caused by failure of engines so maintenance will be needed as soon as possible. By using classification algorithm of machine learning, it must be possible to predict fatal failure of automobiles, trains and even homes.  All notifications will be sent to smartphones in real-time basis. It leads to green society as efficiency are increasing in terms of energy consumption and emission control.


5. Investment technology

I have rarely heard that new technologies will be introduced in investment and asset management in 2014 as far as I concerned.  However I imagine that some of fin-tech companies might use reinforcement learning, one of the categories of machine leaning.  Unlike the image recognition and machine translation, right answers are not so clear in the fields of investment and asset management. It might be solved by reinforcement learning  in practice in order to apply machine learning into this field. Of course, the results of analysis must be sent to smart phone in real-time basis to support investment decisions.


Mobile services will be enhanced in 2015 dramatically because machine learning technologies are connected to mobile phone of each customer. Mobile service with machine learning will change the landscape of each industries sooner rather than later. Congratulations!