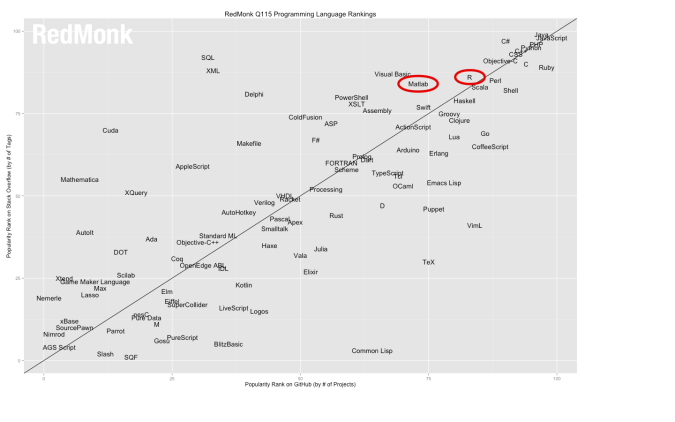
RedMonk issued the raking about popularity of programming languages. This research is conducted periodically since 2010. This chart below is coming from this research. Although general purpose languages such as JavaScript occupy top 10 ranking, statistical language is getting popular. R is ranked 13th and MATLAB is ranked 16th. I have used MATLAB since 2001 and R since 2013 and currently study JavaScript. Then I found that the deference between R, which is statistical language, and other general purpose languages. Let us consider it in details and good way to learn statistical languages such as R and MATLAB.
1. R focuses on data
Because R is a statistical language, it focuses on data to be analyzed. These data are handled in R as vectors and matrices. Unlike JavaScript, there is no need to define variables to handle data in R. There is no need to distinguish between scalar and vector, either. So it is easy to start analyzing data with R, especially for beginners. Therefore I think the best way to learn R is to be familiar with vectors and matrices because data is represented as vectors or matrices in R.
2. R has a lot of functions to analyze data
R has a lot of functions because many professionals contribute to develop statistical models with R. Currently there are more than 7000 functions, which are called “R package”. This is one of the biggest advantages to learn R for data analysis. If you are interested in “liner regression model” , which is the most simple model to predict price of services and goods, all you have to do is just writing command “lm” then R can output the parameters so that predictions of prices can be obtained.
3. R is easy to visualize data
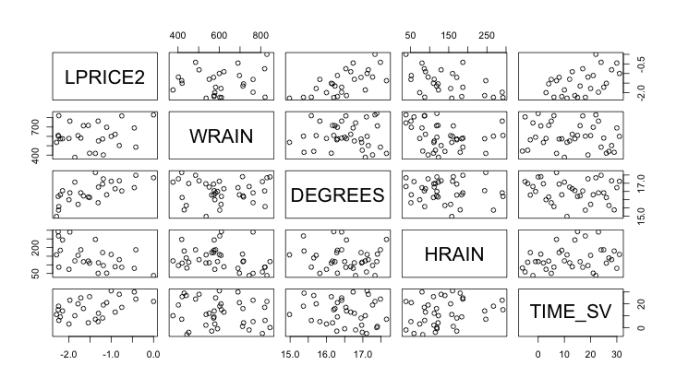
If you would like to draw the graph, all you have to do is to write the code ‘plot’ then simple graph appears on the screen. When there are a lot of series of data and you would like to know relationship among each of them and other, all you have to do is to write the code ‘pairs’ then a lot of scatter charts appear so that we can understand the relationship among each of them. Please look at the example of charts by “pairs”.
R is open source and free to anyone. However MATLAB is proprietary software. It means that you should buy licenses of MATLAB if you would like to use it. But do not worry about that. Octave, which is similar to MATLAB, is available without license fee as an open source software. I recommend you to use R or Octave for beginners of data analysis because there is no need to pay any fee.
Going forward, R must be more popular in programming languages. It is available for everyone without any cost. R is introduced as a major language for data analysis in my company and I would recommend all of you to learn R as I do. Is it fun, isn’t it?


